Regions Bank 2011 Annual Report Download - page 7
Download and view the complete annual report
Please find page 7 of the 2011 Regions Bank annual report below. You can navigate through the pages in the report by either clicking on the pages listed below, or by using the keyword search tool below to find specific information within the annual report.-
 1
1 -
 2
2 -
 3
3 -
 4
4 -
 5
5 -
 6
6 -
 7
7 -
 8
8 -
 9
9 -
 10
10 -
 11
11 -
 12
12 -
 13
13 -
 14
14 -
 15
15 -
 16
16 -
 17
17 -
 18
18 -
19
-
20
-
21
-
22
-
23
-
24
-
25
-
26
-
27
-
28
-
29
-
30
-
31
-
32
-
33
-
34
-
35
-
36
-
37
-
38
-
39
-
40
-
41
-
42
-
43
-
44
-
45
-
46
-
47
-
48
-
49
-
50
-
51
-
52
-
53
-
54
-
55
-
56
-
57
-
58
-
59
-
60
-
61
-
62
-
63
-
64
-
65
-
66
-
67
-
68
-
69
-
70
-
71
-
72
-
73
-
74
-
75
-
76
-
77
-
78
-
79
-
80
-
81
-
82
-
83
-
84
-
85
-
86
-
87
-
88
-
89
-
90
-
91
-
92
-
93
-
94
-
95
-
96
-
97
-
98
-
99
-
100
-
101
-
102
-
103
-
104
-
105
-
106
-
107
-
108
-
109
-
110
-
111
-
112
-
113
-
114
-
115
-
116
-
117
-
118
-
119
-
120
-
121
-
122
-
123
-
124
-
125
-
126
-
127
-
128
-
129
-
130
-
131
-
132
-
133
-
134
-
135
-
136
-
137
-
138
-
139
-
140
-
141
-
142
-
143
-
144
-
145
-
146
-
147
-
148
-
149
-
150
-
151
-
152
-
153
-
154
-
155
-
156
-
157
-
158
-
159
-
160
-
161
-
162
-
163
-
164
-
165
-
166
-
167
-
168
-
169
-
170
-
171
-
172
-
173
-
174
-
175
-
176
-
177
-
178
-
179
-
180
-
181
-
182
-
183
-
184
-
185
-
186
-
187
-
188
-
189
-
190
-
191
-
192
-
193
-
194
-
195
-
196
-
197
-
198
-
199
-
200
-
201
-
202
-
203
-
204
-
205
-
206
-
207
-
208
-
209
-
210
-
211
-
212
-
213
-
214
-
215
-
216
-
217
-
218
-
219
-
220
-
221
-
222
-
223
-
224
-
225
-
226
-
227
-
228
-
229
-
230
-
231
-
232
-
233
-
234
-
235
-
236
-
237
-
238
-
239
-
240
-
241
-
242
-
243
-
244
-
245
-
246
-
247
-
248
-
249
-
250
-
251
-
252
-
253
-
254
-
255
-
256
-
257
-
258
-
259
-
260
-
261
-
262
-
263
-
264
-
265
-
266
-
267
-
268
 |
 |

REGIONS 2011 ANNUAL REPORT 5
recovery, which has been slower than we would
have liked, we do expect credit costs to con-
tinue their downward trend into 2012.
Loan Growth. Refl ecting both consumers’ and
business owners’ lack of confi dence in our na-
tion’s economic recovery, overall loan demand
remains weak. In the last fi ve years, consumer
home equity loan applications have declined
75%, while loan approvals have remained
steady. Businesses and consumers who are not
confi dent in the economic outlook simply will
not take on the risk of additional debt if they
can avoid it.
In spite of this environment, Regions extended
$60 billion in new credit in 2011 and $185 bil-
lion since 2009. Our loan production included
$51 billion of business loans, of which $15 bil-
lion were new commitments. Our consumer
loan production totaled $9 billion, a 16% de-
cline over 2010.
We also made the strategic decision to re-enter
the credit card business for consumers and
small businesses as part of our effort to further
diversify our revenue streams and better serve
our customers. In just six months, we increased
our account production by 5% and generated
$1.1 billion in outstanding loans on the balance
sheet and an additional $6.7 billion in available
credit for our customers. In addition, consistent
with our strategy of expanding our loan product
offerings to meet consumer demand and mar-
ket conditions, we also re-entered the indirect
auto lending business, which generated $1 bil-
lion in volume for the year. This was one of the
primary drivers of total consumer loan volume,
which increased 36% in 2011.
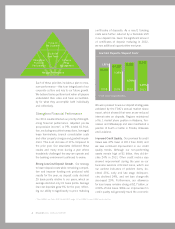
Capital and Liquidity Strength. Regions’ capi-
tal levels – a key measure of a bank’s fi nancial
strength – are strong, and we are confi dent they
will remain so even as tougher capital stan-
dards are imposed. Clearly, the de-risking of
our portfolio over the last three years has paid
tremendous dividends in terms of enhancing
our portfolio.
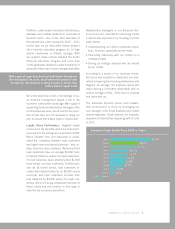
At December 31, 2011, our capital levels also
exceeded Basel III requirements, with a Tier 1
ratio standing at 11.4% and a Tier 1 common1
ratio totaling 7.7%. Since the end of 2010,
our Tier 1 common1 capital increased 66 basis
points to end the year at 8.5%. Liquidity at both
the bank and the holding company remains
solid. We are primarily core funded and have
a loan to deposit ratio of 81%. Cash at the par-
ent holding company totaled $2.5 billion and
is above our policy minimums of maintaining
a suffi cient level of funding to meet projected
cash needs, which include all debt service,
dividends and maturities for the next two years.
As part of our process to evaluate how to best
manage our capital and increase shareholder
value, in January of this year we announced that
we entered into a stock purchase agreement
to sell Morgan Keegan & Company, Inc. and
related affi liates to Raymond James Financial
Inc., for $930 million. As part of the transaction,
Morgan Keegan is expected to pay Regions a
dividend of $250 million before closing, pending
regulatory approval, resulting in total proceeds
of approximately $1.18 billion to Regions.
Businesses and consumers who are not confi dent
in the economic outlook simply will not take on the
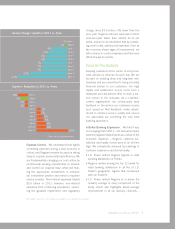
risk of additional debt if they can avoid it. Tier 1 Common1 Ratio
6.57 %
7. 1 5 %
7.85 %
8.51%
2008
2009
2010
2011
1 Non-GAAP, see Form 10-K Table 2 for GAAP to non-GAAP reconciliation