Regions Bank 2011 Annual Report Download - page 174
Download and view the complete annual report
Please find page 174 of the 2011 Regions Bank annual report below. You can navigate through the pages in the report by either clicking on the pages listed below, or by using the keyword search tool below to find specific information within the annual report.-
 1
1 -
2
-
3
-
4
-
5
-
6
-
7
-
8
-
9
-
10
-
11
-
12
-
13
-
14
-
15
-
16
-
17
-
18
-
19
-
20
-
21
-
22
-
23
-
24
-
25
-
26
-
27
-
28
-
29
-
30
-
31
-
32
-
33
-
34
-
35
-
36
-
37
-
38
-
39
-
40
-
41
-
42
-
43
-
44
-
45
-
46
-
47
-
48
-
49
-
50
-
51
-
52
-
53
-
54
-
55
-
56
-
57
-
58
-
59
-
60
-
61
-
62
-
63
-
64
-
65
-
66
-
67
-
68
-
69
-
70
-
71
-
72
-
73
-
74
-
75
-
76
-
77
-
78
-
79
-
80
-
81
-
82
-
83
-
84
-
85
-
86
-
87
-
88
-
89
-
90
-
91
-
92
-
93
-
94
-
95
-
96
-
97
-
98
-
99
-
100
-
101
-
102
-
103
-
104
-
105
-
106
-
107
-
108
-
109
-
110
-
111
-
112
-
113
-
114
-
115
-
116
-
117
-
118
-
119
-
120
-
121
-
122
-
123
-
124
-
125
-
126
-
127
-
128
-
129
-
130
-
131
-
132
-
133
-
134
-
135
-
136
-
137
-
138
-
139
-
140
-
141
-
142
-
143
-
144
-
145
-
146
-
147
-
148
-
149
-
150
-
151
-
152
-
153
-
154
-
155
-
156
-
157
-
158
-
159
-
160
-
161
-
162
-
163
-
 164
164 -
 165
165 -
 166
166 -
 167
167 -
 168
168 -
 169
169 -
 170
170 -
 171
171 -
 172
172 -
 173
173 -
 174
174 -
 175
175 -
 176
176 -
 177
177 -
 178
178 -
 179
179 -
 180
180 -
 181
181 -
 182
182 -
 183
183 -
 184
184 -
185
-
186
-
187
-
188
-
189
-
190
-
191
-
192
-
193
-
194
-
195
-
196
-
197
-
198
-
199
-
200
-
201
-
202
-
203
-
204
-
205
-
206
-
207
-
208
-
209
-
210
-
211
-
212
-
213
-
214
-
215
-
216
-
217
-
218
-
219
-
220
-
221
-
222
-
223
-
224
-
225
-
226
-
227
-
228
-
229
-
230
-
231
-
232
-
233
-
234
-
235
-
236
-
237
-
238
-
239
-
240
-
241
-
242
-
243
-
244
-
245
-
246
-
247
-
248
-
249
-
250
-
251
-
252
-
253
-
254
-
255
-
256
-
257
-
258
-
259
-
260
-
261
-
262
-
263
-
264
-
265
-
266
-
267
-
268
 |
 |

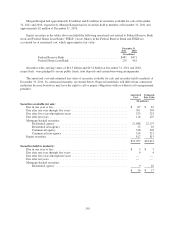
Morgan Keegan had approximately $2 million and $1 million in securities available for sale at December,
31, 2011 and 2010, respectively. Morgan Keegan had no securities held to maturity at December 31, 2011 and
approximately $2 million at December 31, 2010.
Equity securities in the tables above included the following amortized cost related to Federal Reserve Bank
stock and Federal Home Loan Bank (“FHLB”) stock. Shares in the Federal Reserve Bank and FHLB are
accounted for at amortized cost, which approximates fair value.
December 31
2011 2010
(In millions)
Federal Reserve Bank ................................... $481 $471
Federal Home Loan Bank ................................ 219 419
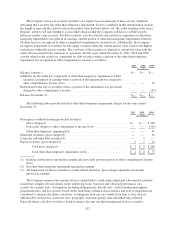
Securities with carrying values of $14.3 billion and $15.4 billion at December 31, 2011 and 2010,
respectively, were pledged to secure public funds, trust deposits and certain borrowing arrangements.
The amortized cost and estimated fair value of securities available for sale and securities held to maturity at
December 31, 2011, by contractual maturity, are shown below. Expected maturities will differ from contractual
maturities because borrowers may have the right to call or prepay obligations with or without call or prepayment
penalties.
Amortized
Cost
Estimated
Fair Value
(In millions)
Securities available for sale:
Due in one year or less .................................................. $ 67 $ 67
Due after one year through five years ...................................... 301 303
Due after five years through ten years ...................................... 323 323
Due after ten years ..................................................... 114 125
Mortgage-backed securities:
Residential agency ................................................. 21,688 22,175
Residential non-agency ............................................. 15 16
Commercial agency ................................................ 318 326
Commercial non-agency ............................................ 314 321
Equity securities ....................................................... 817 815
$23,957 $24,471
Securities held to maturity:
Due in one year or less .................................................. $ 3 $ 3
Due after one year through five years ...................................... 4 4
Due after five years through ten years ...................................... — —
Due after ten years ..................................................... — —
Mortgage-backed securities:
Residential agency ................................................. 9 10
$16$17
150