Regions Bank 2011 Annual Report Download - page 179
Download and view the complete annual report
Please find page 179 of the 2011 Regions Bank annual report below. You can navigate through the pages in the report by either clicking on the pages listed below, or by using the keyword search tool below to find specific information within the annual report.-
 1
1 -
2
-
3
-
4
-
5
-
6
-
7
-
8
-
9
-
10
-
11
-
12
-
13
-
14
-
15
-
16
-
17
-
18
-
19
-
20
-
21
-
22
-
23
-
24
-
25
-
26
-
27
-
28
-
29
-
30
-
31
-
32
-
33
-
34
-
35
-
36
-
37
-
38
-
39
-
40
-
41
-
42
-
43
-
44
-
45
-
46
-
47
-
48
-
49
-
50
-
51
-
52
-
53
-
54
-
55
-
56
-
57
-
58
-
59
-
60
-
61
-
62
-
63
-
64
-
65
-
66
-
67
-
68
-
69
-
70
-
71
-
72
-
73
-
74
-
75
-
76
-
77
-
78
-
79
-
80
-
81
-
82
-
83
-
84
-
85
-
86
-
87
-
88
-
89
-
90
-
91
-
92
-
93
-
94
-
95
-
96
-
97
-
98
-
99
-
100
-
101
-
102
-
103
-
104
-
105
-
106
-
107
-
108
-
109
-
110
-
111
-
112
-
113
-
114
-
115
-
116
-
117
-
118
-
119
-
120
-
121
-
122
-
123
-
124
-
125
-
126
-
127
-
128
-
129
-
130
-
131
-
132
-
133
-
134
-
135
-
136
-
137
-
138
-
139
-
140
-
141
-
142
-
143
-
144
-
145
-
146
-
147
-
148
-
149
-
150
-
151
-
152
-
153
-
154
-
155
-
156
-
157
-
158
-
159
-
160
-
161
-
162
-
163
-
164
-
165
-
166
-
167
-
168
-
 169
169 -
 170
170 -
 171
171 -
 172
172 -
 173
173 -
 174
174 -
 175
175 -
 176
176 -
 177
177 -
 178
178 -
 179
179 -
 180
180 -
 181
181 -
 182
182 -
 183
183 -
 184
184 -
 185
185 -
 186
186 -
 187
187 -
 188
188 -
 189
189 -
190
-
191
-
192
-
193
-
194
-
195
-
196
-
197
-
198
-
199
-
200
-
201
-
202
-
203
-
204
-
205
-
206
-
207
-
208
-
209
-
210
-
211
-
212
-
213
-
214
-
215
-
216
-
217
-
218
-
219
-
220
-
221
-
222
-
223
-
224
-
225
-
226
-
227
-
228
-
229
-
230
-
231
-
232
-
233
-
234
-
235
-
236
-
237
-
238
-
239
-
240
-
241
-
242
-
243
-
244
-
245
-
246
-
247
-
248
-
249
-
250
-
251
-
252
-
253
-
254
-
255
-
256
-
257
-
258
-
259
-
260
-
261
-
262
-
263
-
264
-
265
-
266
-
267
-
268
 |
 |

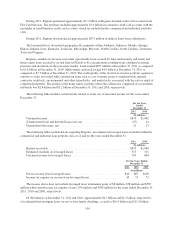
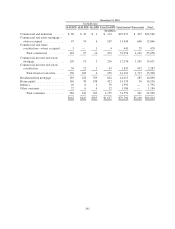
respectively, of home equity loans held by Regions were pledged to secure borrowings from the FHLB (see Note
12 for further discussion). At December 31, 2011, approximately $9.0 billion of commercial and industrial loans,
$9.7 billion of owner-occupied commercial real estate and investor real estate loans and $709 million of other
consumer loans held by Regions were pledged to the Federal Reserve Bank. At December 31, 2010,
approximately $9.8 billion of commercial and industrial loans, $15.9 billion of owner-occupied commercial real
estate and investor real estate loans and $1.1 billion of other consumer loans held by Regions were pledged to the
Federal Reserve Bank.
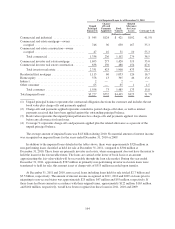
Directors and executive officers of Regions and its principal subsidiaries, including the directors’ and
officers’ families and affiliated companies, are loan and deposit customers and have other transactions with
Regions in the ordinary course of business. Total loans to these persons (excluding loans which in the aggregate
do not exceed $60,000 to any such person) at December 31, 2011 and 2010 were approximately $154 million and
$156 million, respectively. These loans were made in the ordinary course of business and on substantially the
same terms, including interest rates and collateral, as those prevailing at the same time for comparable
transactions with other persons and involve no unusual risk of collectability.
NOTE 6. ALLOWANCE FOR CREDIT LOSSES
The allowance for credit losses represents management’s estimate of credit losses inherent in the loan and
credit commitment portfolios as of year-end. The allowance for credit losses consists of two components: the
allowance for loan and lease losses and the reserve for unfunded credit commitments. Management’s assessment
of the appropriateness of the allowance for credit losses is based on a combination of both of these components.
Regions determines its allowance for credit losses in accordance with applicable accounting literature as well as
regulatory guidance related to receivables and contingencies. Binding unfunded credit commitments include
items such as letters of credit, financial guarantees and binding unfunded loan commitments.
CALCULATION OF ALLOWANCE FOR CREDIT LOSSES
Commercial and Investor Real Estate Components
Impaired Loans
For non-accrual commercial and investor real estate loans (including TDRs) equal to or greater than $2.5
million, the allowance for loan losses is based on specific evaluation considering the facts and circumstances
specific to each borrower. Beginning in the third quarter of 2011, for commercial and investor real estate
accruing TDRs and non-accruing TDRs less than $2.5 million, the allowance for loan losses is based on a
discounted cash flow analysis performed at the note level, where projected cash flows reflect credit losses based
on statistical information (including historical default information) derived from loans with similar risk
characteristics (e.g., credit quality indicator and product type) using probability of default (“PD”) and loss-given
default (“LGD”) as described in the following paragraph. Prior to this change, accruing TDRs equal to or greater
than $2.5 million were evaluated using the specific identification method, and all TDRs less than $2.5 million
were evaluated in the pooled methodology described below. This change in the estimation process did not have a
material impact to the overall level of the allowance for loan losses or the provision for loan losses.
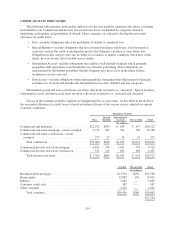
Non-Impaired Loans
For all other commercial and investor real estate loans, the allowance for loan losses is calculated at a pool
level based on credit quality indicators and product type. A statistically determined PD and LGD are calculated.
Historical default information for similar loans is used as an input for the statistical model. Additionally, LGD
estimates for certain commercial and investor real estate properties are updated within the allowance calculation
quarterly using historical loss information that incorporates standard discount factors applied when those
properties are transferred into foreclosed properties. The standard discount factor is based on historical amounts
realized upon ultimate disposition of these properties. The pool level allowance is calculated using the PD and
LGD estimates.
155