Regions Bank 2011 Annual Report Download - page 101
Download and view the complete annual report
Please find page 101 of the 2011 Regions Bank annual report below. You can navigate through the pages in the report by either clicking on the pages listed below, or by using the keyword search tool below to find specific information within the annual report.-
 1
1 -
2
-
3
-
4
-
5
-
6
-
7
-
8
-
9
-
10
-
11
-
12
-
13
-
14
-
15
-
16
-
17
-
18
-
19
-
20
-
21
-
22
-
23
-
24
-
25
-
26
-
27
-
28
-
29
-
30
-
31
-
32
-
33
-
34
-
35
-
36
-
37
-
38
-
39
-
40
-
41
-
42
-
43
-
44
-
45
-
46
-
47
-
48
-
49
-
50
-
51
-
52
-
53
-
54
-
55
-
56
-
57
-
58
-
59
-
60
-
61
-
62
-
63
-
64
-
65
-
66
-
67
-
68
-
69
-
70
-
71
-
72
-
73
-
74
-
75
-
76
-
77
-
78
-
79
-
80
-
81
-
82
-
83
-
84
-
85
-
86
-
87
-
88
-
89
-
90
-
 91
91 -
 92
92 -
 93
93 -
 94
94 -
 95
95 -
 96
96 -
 97
97 -
 98
98 -
 99
99 -
 100
100 -
 101
101 -
 102
102 -
 103
103 -
 104
104 -
 105
105 -
 106
106 -
 107
107 -
 108
108 -
 109
109 -
 110
110 -
 111
111 -
112
-
113
-
114
-
115
-
116
-
117
-
118
-
119
-
120
-
121
-
122
-
123
-
124
-
125
-
126
-
127
-
128
-
129
-
130
-
131
-
132
-
133
-
134
-
135
-
136
-
137
-
138
-
139
-
140
-
141
-
142
-
143
-
144
-
145
-
146
-
147
-
148
-
149
-
150
-
151
-
152
-
153
-
154
-
155
-
156
-
157
-
158
-
159
-
160
-
161
-
162
-
163
-
164
-
165
-
166
-
167
-
168
-
169
-
170
-
171
-
172
-
173
-
174
-
175
-
176
-
177
-
178
-
179
-
180
-
181
-
182
-
183
-
184
-
185
-
186
-
187
-
188
-
189
-
190
-
191
-
192
-
193
-
194
-
195
-
196
-
197
-
198
-
199
-
200
-
201
-
202
-
203
-
204
-
205
-
206
-
207
-
208
-
209
-
210
-
211
-
212
-
213
-
214
-
215
-
216
-
217
-
218
-
219
-
220
-
221
-
222
-
223
-
224
-
225
-
226
-
227
-
228
-
229
-
230
-
231
-
232
-
233
-
234
-
235
-
236
-
237
-
238
-
239
-
240
-
241
-
242
-
243
-
244
-
245
-
246
-
247
-
248
-
249
-
250
-
251
-
252
-
253
-
254
-
255
-
256
-
257
-
258
-
259
-
260
-
261
-
262
-
263
-
264
-
265
-
266
-
267
-
268
 |
 |
differences that will be exempt from taxation, primarily tax-exempt interest income and bank-owned
life insurance, as well as temporary book-tax differences including the allowance for loan losses. The
projections relied upon for this process are consistent with those used from the Company’s financial
forecasting process.
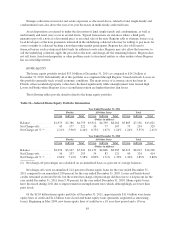
• Strong capital position—At December 31, 2011, the Company had a Tier 1 capital ratio of 13.28
percent, substantially above the 6.0 percent minimum standard to be well capitalized. Also, the Total
capital ratio of 16.99 percent substantially exceeds the 10.0 percent minimum standard to be well
capitalized. The Company’s Tier 1 common ratio (non-GAAP) was 8.5 percent at December 31, 2011
(see Table 2 “GAAP to Non-GAAP Reconciliation” for further details). The Board of Governors of the
Federal Reserve System has proposed 5 percent as the level of Tier 1 common capital sufficient to
withstand adverse economic scenarios.
• Ability to implement tax-planning strategies—The Company has the ability to implement tax planning
strategies to maximize the realization of deferred tax assets, such as the sale of assets. As an example,
at December 31, 2011, the Company’s portfolio of securities available for sale had $532 million of
gross unrealized pre-tax gains which could accelerate the recognition of the associated taxable
temporary differences, which management would consider being a tax planning strategy to maximize
the realization of the deferred tax assets that may expire unutilized.
Negative Evidence
• Cumulative loss position—The Company is currently in a three-year cumulative loss position.
Excluding the goodwill impairment in 2011 and a portion of the regulatory charge taken in 2010, as
these items are nondeductible for income tax purposes, the cumulative continuing operations pre-tax
loss position for 2009 through 2011 is $1.7 billion. The cumulative loss has resulted from the
unprecedented provision for loan losses of $7.9 billion during these periods, which management
believes will continue to be reduced in future periods. During 2011, the provision for loan losses
decreased $1.4 billion to $1.5 billion, as compared to the provision for loan losses of $2.9 billion in
2010. Additionally, absent the goodwill impairment, Regions would have reported positive net income
available to common shareholders for 2011, providing positive evidence regarding the Company’s
earnings.
The Company believes the positive evidence, when considered in its entirety, outweighs the negative
evidence of recent pre-tax losses.
See Note 1 “Summary of Significant Accounting Policies” and Note 19 “Income Taxes” to the consolidated
financial statements for additional information about income taxes.
BALANCE SHEET ANALYSIS
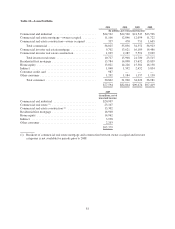
At December 31, 2011, Regions reported total assets of $127.1 billion compared to $132.4 billion at the end
of 2010, a decrease of approximately $5.3 billion or 4 percent. Loans, net of unearned income, declined
approximately $5.3 billion, primarily related to the investor real estate segment. Goodwill declined between
years as a result of the goodwill impairment recognized in the Investment/Banking/Brokerage/Trust segment
related to the process of selling Morgan Keegan as further discussed in Note 9 “Intangible Assets.” Other assets
also declined between years due to variations in settlements of securities sales. Offsetting these declines was an
approximate $1.2 billion increase in securities available for sale.
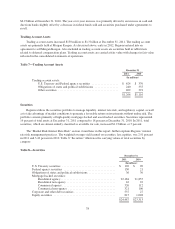
Cash and Cash Equivalents
Cash and cash equivalents include cash and due from banks, interest-bearing deposits in other banks
(including the Federal Reserve Bank), and Federal funds sold and securities purchased under agreements to resell
(which have a life of 90 days or less). At December 31, 2011, these assets totaled $7.2 billion as compared to
77