Regions Bank 2011 Annual Report Download - page 103
Download and view the complete annual report
Please find page 103 of the 2011 Regions Bank annual report below. You can navigate through the pages in the report by either clicking on the pages listed below, or by using the keyword search tool below to find specific information within the annual report.-
 1
1 -
2
-
3
-
4
-
5
-
6
-
7
-
8
-
9
-
10
-
11
-
12
-
13
-
14
-
15
-
16
-
17
-
18
-
19
-
20
-
21
-
22
-
23
-
24
-
25
-
26
-
27
-
28
-
29
-
30
-
31
-
32
-
33
-
34
-
35
-
36
-
37
-
38
-
39
-
40
-
41
-
42
-
43
-
44
-
45
-
46
-
47
-
48
-
49
-
50
-
51
-
52
-
53
-
54
-
55
-
56
-
57
-
58
-
59
-
60
-
61
-
62
-
63
-
64
-
65
-
66
-
67
-
68
-
69
-
70
-
71
-
72
-
73
-
74
-
75
-
76
-
77
-
78
-
79
-
80
-
81
-
82
-
83
-
84
-
85
-
86
-
87
-
88
-
89
-
90
-
91
-
92
-
 93
93 -
 94
94 -
 95
95 -
 96
96 -
 97
97 -
 98
98 -
 99
99 -
 100
100 -
 101
101 -
 102
102 -
 103
103 -
 104
104 -
 105
105 -
 106
106 -
 107
107 -
 108
108 -
 109
109 -
 110
110 -
 111
111 -
 112
112 -
 113
113 -
114
-
115
-
116
-
117
-
118
-
119
-
120
-
121
-
122
-
123
-
124
-
125
-
126
-
127
-
128
-
129
-
130
-
131
-
132
-
133
-
134
-
135
-
136
-
137
-
138
-
139
-
140
-
141
-
142
-
143
-
144
-
145
-
146
-
147
-
148
-
149
-
150
-
151
-
152
-
153
-
154
-
155
-
156
-
157
-
158
-
159
-
160
-
161
-
162
-
163
-
164
-
165
-
166
-
167
-
168
-
169
-
170
-
171
-
172
-
173
-
174
-
175
-
176
-
177
-
178
-
179
-
180
-
181
-
182
-
183
-
184
-
185
-
186
-
187
-
188
-
189
-
190
-
191
-
192
-
193
-
194
-
195
-
196
-
197
-
198
-
199
-
200
-
201
-
202
-
203
-
204
-
205
-
206
-
207
-
208
-
209
-
210
-
211
-
212
-
213
-
214
-
215
-
216
-
217
-
218
-
219
-
220
-
221
-
222
-
223
-
224
-
225
-
226
-
227
-
228
-
229
-
230
-
231
-
232
-
233
-
234
-
235
-
236
-
237
-
238
-
239
-
240
-
241
-
242
-
243
-
244
-
245
-
246
-
247
-
248
-
249
-
250
-
251
-
252
-
253
-
254
-
255
-
256
-
257
-
258
-
259
-
260
-
261
-
262
-
263
-
264
-
265
-
266
-
267
-
268
 |
 |

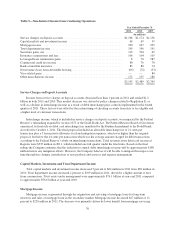
In conjunction with the Company’s asset/liability management process, during 2011, Regions sold agency
securities available for sale and reinvested the proceeds predominantly into similar securities with shorter
durations. Additionally, during the second half of 2011, Regions purchased approximately $493 million of
corporate bonds in an effort to increase diversification in the investment portfolio and reduce exposure to
mortgage refinance risk through a sector that has an attractive risk and return profile. During 2011, Regions sold
approximately $7.9 billion of securities and recognized approximately $112 million in net gains.
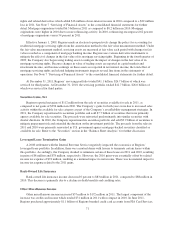
Net unrealized gains and losses in the securities available for sale portfolio are included in stockholders’
equity as accumulated other comprehensive income or loss, net of tax. At December 31, 2011, securities
available for sale included a net unrealized gain of $514 million, which represented the difference between the
estimated fair value of these securities as of year-end and their amortized cost. The net unrealized gain represents
$532 million in gross unrealized gains and $18 million in gross unrealized losses. At December 31, 2010,
securities available for sale included a net unrealized gain of $120 million, comprised of $283 million in gross
unrealized gains and $163 million in gross unrealized losses.
The Company reviews its securities portfolio on a regular basis to determine if there are any conditions
indicating that a security has other-than-temporary impairment. Factors considered in this determination include
the length of time and the extent to which the market value has been below cost, the credit standing of the issuer,
Regions’ intent to sell and whether it is more likely than not that the Company will have to sell the security
before its market value recovers. During 2011, Regions recognized in earnings approximately $2 million of
securities impairments, related to equity securities. During 2010, Regions recognized in earnings approximately
$2 million of securities impairments, related to equity and other debt securities. See Note 4 “Securities” to the
consolidated financial statements for further details.
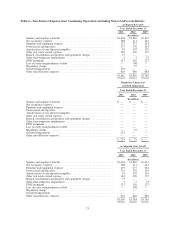
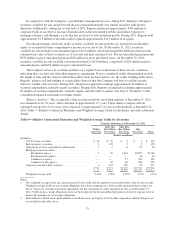
Maturity Analysis—The average life of the securities portfolio (excluding equities) at December 31, 2011
was estimated to be 3.9 years, with a duration of approximately 2.1 years. These metrics compare with an
estimated average life of 6.6 years, with a duration of approximately 3.4 years for the portfolio at December 31,
2010. Table 9 “Relative Contractual Maturities and Weighted-Average Yields for Securities” provides additional
details.
Table 9—Relative Contractual Maturities and Weighted-Average Yields for Securities
Securities Maturing as of December 31, 2011
Within
One Year
After One
But Within
Five Years
After Five
But Within
Ten Years
After
Ten Years Total
(Dollars in millions)
Securities:
U.S. Treasury securities ............................ $ 59 $ 39 $ 3 $ 1 $ 102
Federal agency securities ........................... 3 139 5 3 150
Obligations of states and political subdivisions .......... 2 6 6 22 36
Mortgage-backed securities .........................
Residential agency ............................ 3 70 1,414 20,697 22,184
Residential non-agency ........................ — — — 16 16
Commercial agency ........................... — — 57 269 326
Commercial non-agency ....................... — 35 46 240 321
Corporate and other debt securities ................... 6 123 309 99 537
$ 73 $ 412 $1,840 $21,347 $23,672
Weighted-average yield ............................ 0.40% 2.89% 2.99% 2.91% 2.91%
Notes:
1. The weighted-average yields are calculated on the basis of the yield to maturity based on the book value of each security.
Weighted-average yields on tax-exempt obligations have been computed on a fully-taxable equivalent basis using a tax
rate of 35 percent. Taxable-equivalent adjustments for the calculation of yields amounted to zero as of December 31,
2011. Yields on tax-exempt obligations have not been adjusted for the non-deductible portion of interest expense used to
finance the purchase of tax-exempt obligations.
2. Federal Reserve Bank stock, Federal Home Loan Bank stock, and equity stock of other corporations held by Regions are
not included in the table above.
79