Regions Bank 2011 Annual Report Download - page 172
Download and view the complete annual report
Please find page 172 of the 2011 Regions Bank annual report below. You can navigate through the pages in the report by either clicking on the pages listed below, or by using the keyword search tool below to find specific information within the annual report.-
 1
1 -
2
-
3
-
4
-
5
-
6
-
7
-
8
-
9
-
10
-
11
-
12
-
13
-
14
-
15
-
16
-
17
-
18
-
19
-
20
-
21
-
22
-
23
-
24
-
25
-
26
-
27
-
28
-
29
-
30
-
31
-
32
-
33
-
34
-
35
-
36
-
37
-
38
-
39
-
40
-
41
-
42
-
43
-
44
-
45
-
46
-
47
-
48
-
49
-
50
-
51
-
52
-
53
-
54
-
55
-
56
-
57
-
58
-
59
-
60
-
61
-
62
-
63
-
64
-
65
-
66
-
67
-
68
-
69
-
70
-
71
-
72
-
73
-
74
-
75
-
76
-
77
-
78
-
79
-
80
-
81
-
82
-
83
-
84
-
85
-
86
-
87
-
88
-
89
-
90
-
91
-
92
-
93
-
94
-
95
-
96
-
97
-
98
-
99
-
100
-
101
-
102
-
103
-
104
-
105
-
106
-
107
-
108
-
109
-
110
-
111
-
112
-
113
-
114
-
115
-
116
-
117
-
118
-
119
-
120
-
121
-
122
-
123
-
124
-
125
-
126
-
127
-
128
-
129
-
130
-
131
-
132
-
133
-
134
-
135
-
136
-
137
-
138
-
139
-
140
-
141
-
142
-
143
-
144
-
145
-
146
-
147
-
148
-
149
-
150
-
151
-
152
-
153
-
154
-
155
-
156
-
157
-
158
-
159
-
160
-
161
-
 162
162 -
 163
163 -
 164
164 -
 165
165 -
 166
166 -
 167
167 -
 168
168 -
 169
169 -
 170
170 -
 171
171 -
 172
172 -
 173
173 -
 174
174 -
 175
175 -
 176
176 -
 177
177 -
 178
178 -
 179
179 -
 180
180 -
 181
181 -
 182
182 -
183
-
184
-
185
-
186
-
187
-
188
-
189
-
190
-
191
-
192
-
193
-
194
-
195
-
196
-
197
-
198
-
199
-
200
-
201
-
202
-
203
-
204
-
205
-
206
-
207
-
208
-
209
-
210
-
211
-
212
-
213
-
214
-
215
-
216
-
217
-
218
-
219
-
220
-
221
-
222
-
223
-
224
-
225
-
226
-
227
-
228
-
229
-
230
-
231
-
232
-
233
-
234
-
235
-
236
-
237
-
238
-
239
-
240
-
241
-
242
-
243
-
244
-
245
-
246
-
247
-
248
-
249
-
250
-
251
-
252
-
253
-
254
-
255
-
256
-
257
-
258
-
259
-
260
-
261
-
262
-
263
-
264
-
265
-
266
-
267
-
268
 |
 |

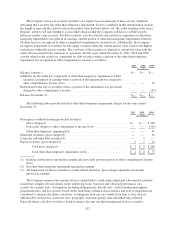
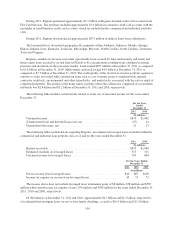
The following table represents the condensed results of operations for discontinued operations for the years
ended December 31:
Year Ended December 31
2011 2010 2009
(In millions, except per share data)
Interest income ..................................................... $ 37 $ 52 $ 55
Interest expense .................................................... 6 9 13
Net interest income ................................................. 31 43 42
Non-interest income:
Brokerage, investment banking and capital markets .................... 938 990 950
Other ........................................................ 57 52 40
Total non-interest income .................................... 995 1,042 990
Non-interest expense:
Salaries and employee benefits .................................... 644 678 634
Net occupancy expense .......................................... 36 37 32
Furniture and equipment expense .................................. 30 27 30
Goodwill impairment ............................................ 492 — —
Regulatory charge .............................................. — 125 —
Other ........................................................ 232 259 270
Total non-interest expense .................................... 1,434 1,126 966
Income (loss) from discontinued operations before income taxes ............. (408) (41) 66
Income tax expense (benefit) .......................................... (4) 30 23
Income (loss) from discontinued operations, net of tax ..................... $ (404) $ (71) $ 43
Earnings (loss) per common share from discontinued operations:
Basic ........................................................ $(0.32) $ (0.06) $0.04
Diluted ....................................................... $(0.32) $ (0.06) $0.04
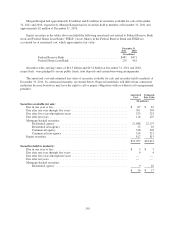
A summary of the major categories of assets and liabilities (including related deferred taxes) of the entities
being sold as of December 31 is as follows:
2011 2010
(In millions)
Assets:
Cash and due from banks ..................... $ 232 $ 69
Securities purchased under agreements to resell .... 200 196
Trading account assets ....................... 1,088 975
Other interest-earning assets ................... 340 404
Goodwill .................................. — 545
Other assets ................................ 944 817
Total assets ............................ $2,804 $3,006
Liabilities:
Securities sold under agreements to repurchase .... $ 253 $ 177
Other short-term borrowings ................... 678 593
Long-term borrowings ........................ — 35
Other liabilities ............................. 914 889
Total liabilities ......................... $1,845 $1,694
148