Regions Bank 2011 Annual Report Download - page 90
Download and view the complete annual report
Please find page 90 of the 2011 Regions Bank annual report below. You can navigate through the pages in the report by either clicking on the pages listed below, or by using the keyword search tool below to find specific information within the annual report.-
 1
1 -
2
-
3
-
4
-
5
-
6
-
7
-
8
-
9
-
10
-
11
-
12
-
13
-
14
-
15
-
16
-
17
-
18
-
19
-
20
-
21
-
22
-
23
-
24
-
25
-
26
-
27
-
28
-
29
-
30
-
31
-
32
-
33
-
34
-
35
-
36
-
37
-
38
-
39
-
40
-
41
-
42
-
43
-
44
-
45
-
46
-
47
-
48
-
49
-
50
-
51
-
52
-
53
-
54
-
55
-
56
-
57
-
58
-
59
-
60
-
61
-
62
-
63
-
64
-
65
-
66
-
67
-
68
-
69
-
70
-
71
-
72
-
73
-
74
-
75
-
76
-
77
-
78
-
79
-
 80
80 -
 81
81 -
 82
82 -
 83
83 -
 84
84 -
 85
85 -
 86
86 -
 87
87 -
 88
88 -
 89
89 -
 90
90 -
 91
91 -
 92
92 -
 93
93 -
 94
94 -
 95
95 -
 96
96 -
 97
97 -
 98
98 -
 99
99 -
 100
100 -
101
-
102
-
103
-
104
-
105
-
106
-
107
-
108
-
109
-
110
-
111
-
112
-
113
-
114
-
115
-
116
-
117
-
118
-
119
-
120
-
121
-
122
-
123
-
124
-
125
-
126
-
127
-
128
-
129
-
130
-
131
-
132
-
133
-
134
-
135
-
136
-
137
-
138
-
139
-
140
-
141
-
142
-
143
-
144
-
145
-
146
-
147
-
148
-
149
-
150
-
151
-
152
-
153
-
154
-
155
-
156
-
157
-
158
-
159
-
160
-
161
-
162
-
163
-
164
-
165
-
166
-
167
-
168
-
169
-
170
-
171
-
172
-
173
-
174
-
175
-
176
-
177
-
178
-
179
-
180
-
181
-
182
-
183
-
184
-
185
-
186
-
187
-
188
-
189
-
190
-
191
-
192
-
193
-
194
-
195
-
196
-
197
-
198
-
199
-
200
-
201
-
202
-
203
-
204
-
205
-
206
-
207
-
208
-
209
-
210
-
211
-
212
-
213
-
214
-
215
-
216
-
217
-
218
-
219
-
220
-
221
-
222
-
223
-
224
-
225
-
226
-
227
-
228
-
229
-
230
-
231
-
232
-
233
-
234
-
235
-
236
-
237
-
238
-
239
-
240
-
241
-
242
-
243
-
244
-
245
-
246
-
247
-
248
-
249
-
250
-
251
-
252
-
253
-
254
-
255
-
256
-
257
-
258
-
259
-
260
-
261
-
262
-
263
-
264
-
265
-
266
-
267
-
268
 |
 |
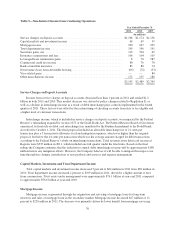
fixed-rate borrowers to accelerate reductions or prepayments of existing loans and securities, which can result in
the replacement of these at lower rates of interest. This pressure impacts portfolios that have a significant
concentration of fixed-rate loans. The taxable investment securities portfolio, which contains significant
residential fixed-rate exposure, for example, decreased in yield from 3.66 percent in 2010 to 3.08 percent in
2011.
The negative influence of low, long-term interest rates on the net interest margin, however, was offset by
improvements in liability costs. The Federal funds rate and the prime rate, which are influential drivers of loan
and deposit pricing on the shorter end of the yield curve, remained low at approximately 0.25 percent and 3.25
percent, respectively, throughout 2011, essentially unchanged from the previous year-end level. The Company’s
loan pricing is also influenced by the 30-day London Interbank Offering Rate (“LIBOR”), which, on average,
was 4 basis points lower in 2011 than 2010, but ranged from a high of 0.30 percent to a low of 0.19 percent
during 2011 and ended the year at 0.30 percent. The 2-year U.S. Treasury benchmark yield is a driver of deposit
pricing on the shorter end of the yield curve, and it also remained low in 2011. The yield on the benchmark
2-year U.S. Treasury note ranged from a high of 0.85 percent to a low of 0.16 percent, and for the year decreased
36 basis points, ending the year at 0.24 percent. With short-term interest rates remaining low, deposit costs
improved considerably from 0.78 percent in 2010 to 0.49 percent in 2011. There was substantial improvement in
costs in every deposit category, including average money market accounts which declined from 0.43 percent to
0.29 percent. The improvement in overall deposit costs was also attributable to a less costly mix of deposits. For
example, average time deposits declined from $26.3 billion, or 27.2 percent of total average deposits, in 2010 to
$21.6 billion, or 22.6 percent of total average deposits, in 2011. Meanwhile, average non-interest bearing
customer deposits increased from $24.0 billion in 2010 to $27.7 billion in 2011.
66