Regions Bank 2011 Annual Report Download - page 195
Download and view the complete annual report
Please find page 195 of the 2011 Regions Bank annual report below. You can navigate through the pages in the report by either clicking on the pages listed below, or by using the keyword search tool below to find specific information within the annual report.-
 1
1 -
2
-
3
-
4
-
5
-
6
-
7
-
8
-
9
-
10
-
11
-
12
-
13
-
14
-
15
-
16
-
17
-
18
-
19
-
20
-
21
-
22
-
23
-
24
-
25
-
26
-
27
-
28
-
29
-
30
-
31
-
32
-
33
-
34
-
35
-
36
-
37
-
38
-
39
-
40
-
41
-
42
-
43
-
44
-
45
-
46
-
47
-
48
-
49
-
50
-
51
-
52
-
53
-
54
-
55
-
56
-
57
-
58
-
59
-
60
-
61
-
62
-
63
-
64
-
65
-
66
-
67
-
68
-
69
-
70
-
71
-
72
-
73
-
74
-
75
-
76
-
77
-
78
-
79
-
80
-
81
-
82
-
83
-
84
-
85
-
86
-
87
-
88
-
89
-
90
-
91
-
92
-
93
-
94
-
95
-
96
-
97
-
98
-
99
-
100
-
101
-
102
-
103
-
104
-
105
-
106
-
107
-
108
-
109
-
110
-
111
-
112
-
113
-
114
-
115
-
116
-
117
-
118
-
119
-
120
-
121
-
122
-
123
-
124
-
125
-
126
-
127
-
128
-
129
-
130
-
131
-
132
-
133
-
134
-
135
-
136
-
137
-
138
-
139
-
140
-
141
-
142
-
143
-
144
-
145
-
146
-
147
-
148
-
149
-
150
-
151
-
152
-
153
-
154
-
155
-
156
-
157
-
158
-
159
-
160
-
161
-
162
-
163
-
164
-
165
-
166
-
167
-
168
-
169
-
170
-
171
-
172
-
173
-
174
-
175
-
176
-
177
-
178
-
179
-
180
-
181
-
182
-
183
-
184
-
 185
185 -
 186
186 -
 187
187 -
 188
188 -
 189
189 -
 190
190 -
 191
191 -
 192
192 -
 193
193 -
 194
194 -
 195
195 -
 196
196 -
 197
197 -
 198
198 -
 199
199 -
 200
200 -
 201
201 -
 202
202 -
 203
203 -
 204
204 -
 205
205 -
206
-
207
-
208
-
209
-
210
-
211
-
212
-
213
-
214
-
215
-
216
-
217
-
218
-
219
-
220
-
221
-
222
-
223
-
224
-
225
-
226
-
227
-
228
-
229
-
230
-
231
-
232
-
233
-
234
-
235
-
236
-
237
-
238
-
239
-
240
-
241
-
242
-
243
-
244
-
245
-
246
-
247
-
248
-
249
-
250
-
251
-
252
-
253
-
254
-
255
-
256
-
257
-
258
-
259
-
260
-
261
-
262
-
263
-
264
-
265
-
266
-
267
-
268
 |
 |

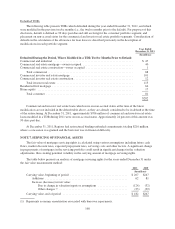
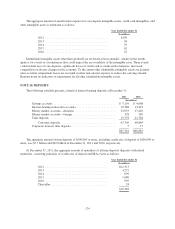
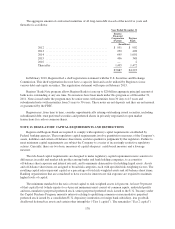
A summary of goodwill activity at December 31 is presented as follows:
2011 2010
(In millions)
Balance at beginning of year ........................................... $5,561 $5,557
Acquisitions of other businesses ........................................ — 4
Impairment ........................................................ (745) —
Balance at end of year ................................................ $4,816 $5,561
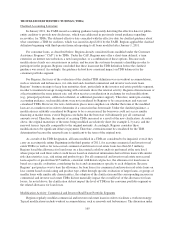
As stated in Note 1, Regions evaluates each reporting unit’s goodwill for impairment on an annual basis in
the fourth quarter, or more often if events or circumstances indicate that there may be impairment. Adverse
changes in the economic environment, declining operations, or other factors could result in a decline in the
implied fair value of goodwill. A goodwill impairment test includes two steps. Step One, used to identify
potential impairment, compares the estimated fair value of a reporting unit with its carrying amount, including
goodwill. If the estimated fair value of a reporting unit exceeds its carrying amount, goodwill of the reporting
unit is considered not impaired. If the carrying amount of a reporting unit exceeds its estimated fair value, the
second step of the goodwill impairment test is performed to measure the amount of impairment loss, if any. Step
Two of the goodwill impairment test compares the implied estimated fair value of reporting unit goodwill with
the carrying amount of that goodwill. If the carrying amount of goodwill for that reporting unit exceeds the
implied fair value of that unit’s goodwill, an impairment loss is recognized in an amount equal to that excess.
Regions tested goodwill for impairment periodically during 2011, 2010 and 2009. Due to the deteriorated
economic environment in the three years ended December 31, 2011, Regions performed annual impairment tests
in the fourth quarters of these periods and interim impairment tests in each quarter of 2011 and 2010 and during
the second and third quarters of 2009. The results of these interim and annual tests indicated that goodwill was
not impaired as of these test dates, except for the impairment in the Investment Banking/Brokerage/Trust
segment during the fourth quarter of 2011.
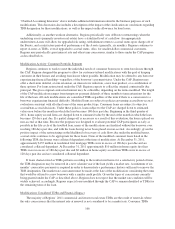
In the fourth quarter of 2011, Regions assessed the indicators of goodwill impairment for all three reporting
units as part of its annual impairment test, as of October 1, 2011, and through the date of the filing of the Annual
Report on Form 10-K for the year ended December 31, 2011. The indicators assessed included:
• Recent operating performance,
• Changes in market capitalization,
• Regulatory actions and assessments,
• Changes in the business climate (including legislation, legal factors and competition),
• Company-specific factors (including changes in key personnel, asset impairments, and business
dispositions), and
• Trends in the banking industry.
For purposes of performing Step One of the goodwill impairment test, Regions uses both the income and
market approaches to value its reporting units. The income approach, which is the primary valuation approach,
consists of discounting projected long-term future cash flows, which are derived from internal forecasts and
economic expectations for the respective reporting units. The significant inputs to the income approach include
expected future cash flows, the long-term target tangible equity to tangible assets ratio, and the discount rate.
Regions utilizes the capital asset pricing model (“CAPM”) in order to derive the base discount rate used in
the income approach The inputs to the CAPM include the 20-year risk-free rate, 5-year beta for a select peer set,
and the market risk premium based on published data. Once the output of the CAPM is determined, a size
premium is added (also based on a published source) as well as a company-specific risk premium, which is an
171