Regions Bank 2011 Annual Report Download - page 197
Download and view the complete annual report
Please find page 197 of the 2011 Regions Bank annual report below. You can navigate through the pages in the report by either clicking on the pages listed below, or by using the keyword search tool below to find specific information within the annual report.-
 1
1 -
2
-
3
-
4
-
5
-
6
-
7
-
8
-
9
-
10
-
11
-
12
-
13
-
14
-
15
-
16
-
17
-
18
-
19
-
20
-
21
-
22
-
23
-
24
-
25
-
26
-
27
-
28
-
29
-
30
-
31
-
32
-
33
-
34
-
35
-
36
-
37
-
38
-
39
-
40
-
41
-
42
-
43
-
44
-
45
-
46
-
47
-
48
-
49
-
50
-
51
-
52
-
53
-
54
-
55
-
56
-
57
-
58
-
59
-
60
-
61
-
62
-
63
-
64
-
65
-
66
-
67
-
68
-
69
-
70
-
71
-
72
-
73
-
74
-
75
-
76
-
77
-
78
-
79
-
80
-
81
-
82
-
83
-
84
-
85
-
86
-
87
-
88
-
89
-
90
-
91
-
92
-
93
-
94
-
95
-
96
-
97
-
98
-
99
-
100
-
101
-
102
-
103
-
104
-
105
-
106
-
107
-
108
-
109
-
110
-
111
-
112
-
113
-
114
-
115
-
116
-
117
-
118
-
119
-
120
-
121
-
122
-
123
-
124
-
125
-
126
-
127
-
128
-
129
-
130
-
131
-
132
-
133
-
134
-
135
-
136
-
137
-
138
-
139
-
140
-
141
-
142
-
143
-
144
-
145
-
146
-
147
-
148
-
149
-
150
-
151
-
152
-
153
-
154
-
155
-
156
-
157
-
158
-
159
-
160
-
161
-
162
-
163
-
164
-
165
-
166
-
167
-
168
-
169
-
170
-
171
-
172
-
173
-
174
-
175
-
176
-
177
-
178
-
179
-
180
-
181
-
182
-
183
-
184
-
185
-
186
-
 187
187 -
 188
188 -
 189
189 -
 190
190 -
 191
191 -
 192
192 -
 193
193 -
 194
194 -
 195
195 -
 196
196 -
 197
197 -
 198
198 -
 199
199 -
 200
200 -
 201
201 -
 202
202 -
 203
203 -
 204
204 -
 205
205 -
 206
206 -
 207
207 -
208
-
209
-
210
-
211
-
212
-
213
-
214
-
215
-
216
-
217
-
218
-
219
-
220
-
221
-
222
-
223
-
224
-
225
-
226
-
227
-
228
-
229
-
230
-
231
-
232
-
233
-
234
-
235
-
236
-
237
-
238
-
239
-
240
-
241
-
242
-
243
-
244
-
245
-
246
-
247
-
248
-
249
-
250
-
251
-
252
-
253
-
254
-
255
-
256
-
257
-
258
-
259
-
260
-
261
-
262
-
263
-
264
-
265
-
266
-
267
-
268
 |
 |

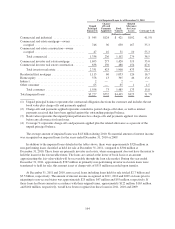
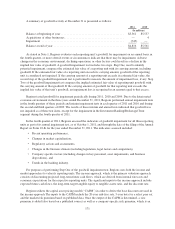
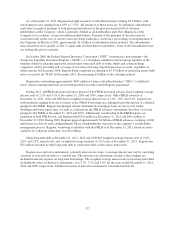
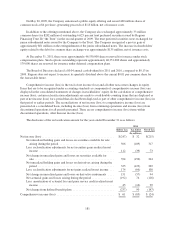
For the Investment Banking/Brokerage/Trust reporting unit, Regions performed and passed Step One of the
goodwill impairment test as of the annual test date in the fourth quarter. Subsequent to that test, Regions received
bids from buyers interested in purchasing the Morgan Keegan component of the Investment Banking/Brokerage/
Trust reporting unit; these bids were significantly below the value indications received from bidders as of
October 1, 2011. The collapse and bankruptcy of a large brokerage firm and subsequent market disruptions that
occurred in November of 2011 impacted the significant price declines related to this component. Accordingly,
Regions tested the goodwill of the Investment Banking/Brokerage/Trust reporting unit as of December 15, 2011
resulting in the reporting unit failing Step One. As a result, Regions conducted Step Two for this reporting unit,
which indicated impairment of all of the $745 million of goodwill allocated to the Investment Banking/
Brokerage/Trust reporting unit. Apart from the observed decline in the equity value of the reporting unit, the
primary drivers of the impairment were recognition of customer and other identifiable intangibles in Step Two
that are not required to be recognized in the GAAP financial statements of the reporting unit but must be
calculated in the Step Two process. The pre-tax $745 million impairment charge was allocated between
continuing operations ($253 million) and discontinued operations ($492 million) based on relative fair values of
the equity of the two components of the reporting unit derived in Step One. The goodwill impairment charge is a
non-cash item that does not have an adverse impact on regulatory capital.
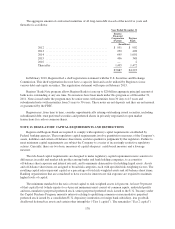
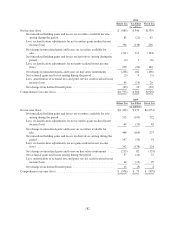
The valuation methodologies of certain material financial assets and liabilities are discussed in Note 1.
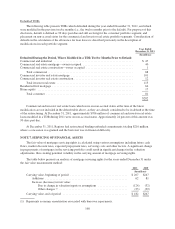
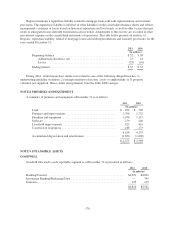
OTHER INTANGIBLES
Other intangibles consist of core deposit intangibles, purchased credit card relationship assets, and customer
relationship and employment agreement assets.
A summary of core deposit intangible assets at December 31 is presented as follows:
2011 2010
(In millions)
Balance at beginning of year, net ................................. $354 $461
Accumulated amortization, beginning of year ................... (657) (550)
Amortization ............................................. (95) (107)
Accumulated amortization, end of year ........................ (752) (657)
Balance at end of year, net ...................................... $259 $354
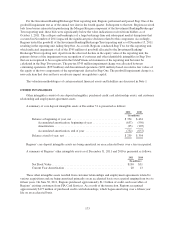
Regions’ core deposit intangible assets are being amortized on an accelerated basis over a ten-year period.
A summary of Regions’ other intangible assets as of December 31, 2011 and 2010 is presented as follows:
2011 2010
(In millions)
Net Book Value ................................................. $190 $31
Current Year Amortization ........................................ 20 13
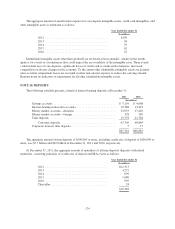
These other intangible assets resulted from customer relationships and employment agreements related to
various acquisitions and are being amortized primarily on an accelerated basis over a period ranging from two to
fifteen years. On June 30, 2011, Regions purchased approximately $1.1 billion of credit card receivables of
Regions’ existing customers from FIA Card Services. As a result of the transaction, Regions recognized
approximately $175 million of purchased credit card relationships, which began amortizing over a fifteen year
life on an accelerated basis.
173