Regions Bank 2011 Annual Report Download - page 88
Download and view the complete annual report
Please find page 88 of the 2011 Regions Bank annual report below. You can navigate through the pages in the report by either clicking on the pages listed below, or by using the keyword search tool below to find specific information within the annual report.-
 1
1 -
2
-
3
-
4
-
5
-
6
-
7
-
8
-
9
-
10
-
11
-
12
-
13
-
14
-
15
-
16
-
17
-
18
-
19
-
20
-
21
-
22
-
23
-
24
-
25
-
26
-
27
-
28
-
29
-
30
-
31
-
32
-
33
-
34
-
35
-
36
-
37
-
38
-
39
-
40
-
41
-
42
-
43
-
44
-
45
-
46
-
47
-
48
-
49
-
50
-
51
-
52
-
53
-
54
-
55
-
56
-
57
-
58
-
59
-
60
-
61
-
62
-
63
-
64
-
65
-
66
-
67
-
68
-
69
-
70
-
71
-
72
-
73
-
74
-
75
-
76
-
77
-
 78
78 -
 79
79 -
 80
80 -
 81
81 -
 82
82 -
 83
83 -
 84
84 -
 85
85 -
 86
86 -
 87
87 -
 88
88 -
 89
89 -
 90
90 -
 91
91 -
 92
92 -
 93
93 -
 94
94 -
 95
95 -
 96
96 -
 97
97 -
 98
98 -
99
-
100
-
101
-
102
-
103
-
104
-
105
-
106
-
107
-
108
-
109
-
110
-
111
-
112
-
113
-
114
-
115
-
116
-
117
-
118
-
119
-
120
-
121
-
122
-
123
-
124
-
125
-
126
-
127
-
128
-
129
-
130
-
131
-
132
-
133
-
134
-
135
-
136
-
137
-
138
-
139
-
140
-
141
-
142
-
143
-
144
-
145
-
146
-
147
-
148
-
149
-
150
-
151
-
152
-
153
-
154
-
155
-
156
-
157
-
158
-
159
-
160
-
161
-
162
-
163
-
164
-
165
-
166
-
167
-
168
-
169
-
170
-
171
-
172
-
173
-
174
-
175
-
176
-
177
-
178
-
179
-
180
-
181
-
182
-
183
-
184
-
185
-
186
-
187
-
188
-
189
-
190
-
191
-
192
-
193
-
194
-
195
-
196
-
197
-
198
-
199
-
200
-
201
-
202
-
203
-
204
-
205
-
206
-
207
-
208
-
209
-
210
-
211
-
212
-
213
-
214
-
215
-
216
-
217
-
218
-
219
-
220
-
221
-
222
-
223
-
224
-
225
-
226
-
227
-
228
-
229
-
230
-
231
-
232
-
233
-
234
-
235
-
236
-
237
-
238
-
239
-
240
-
241
-
242
-
243
-
244
-
245
-
246
-
247
-
248
-
249
-
250
-
251
-
252
-
253
-
254
-
255
-
256
-
257
-
258
-
259
-
260
-
261
-
262
-
263
-
264
-
265
-
266
-
267
-
268
 |
 |
Other identifiable intangible assets, primarily core deposit intangibles and credit card intangibles, are
reviewed at least annually (usually in the fourth quarter) for events or circumstances which could impact the
recoverability of the intangible asset. These events could include loss of core deposits, significant losses of credit
card accounts and/or balances, increased competition or adverse changes in the economy. To the extent an other
identifiable intangible asset is deemed unrecoverable, an impairment loss would be recorded to reduce the
carrying amount. These events or circumstances, if they occur, could be material to Regions’ operating results for
any particular reporting period but the potential impact cannot be reasonably estimated.
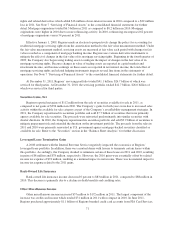
Mortgage Servicing Rights
Regions estimates the fair value of its mortgage servicing rights in order to record them at fair value on the
balance sheet. Although sales of mortgage servicing rights do occur, mortgage servicing rights do not trade in an
active market with readily observable market prices and the exact terms and conditions of sales may not be
readily available, and are therefore Level 3 valuations in the fair value hierarchy previously discussed in the “Fair
Value Measurements” section. Specific characteristics of the underlying loans greatly impact the estimated value
of the related mortgage servicing rights. As a result, Regions stratifies its mortgage servicing portfolio on the
basis of certain risk characteristics, including loan type and contractual note rate, and values its mortgage
servicing rights using discounted cash flow modeling techniques. These techniques require management to make
estimates regarding future net servicing cash flows, taking into consideration historical and forecasted mortgage
loan prepayment rates, discount rates, escrow balances and servicing costs. Changes in interest rates, prepayment
speeds or other factors impact the fair value of mortgage servicing rights which impacts earnings. Based on a
hypothetical sensitivity analysis, Regions estimates that a reduction in primary mortgage market rates of 25 basis
points and 50 basis points would reduce the December 31, 2011 fair value of mortgage servicing rights by
approximately 11 percent ($20 million) and 21 percent ($38 million), respectively. Conversely, 25 basis point
and 50 basis point increases in these rates would increase the December 31, 2011 fair value of mortgage
servicing rights by approximately 12 percent ($21 million) and 24 percent ($43 million), respectively. Regions
also estimates that an increase in servicing costs of approximately $10 per loan, or 17 percent, would result in a
decline in the value of the mortgage servicing rights by approximately $7 million or 2 basis points.
The pro forma fair value analysis presented above demonstrates the sensitivity of fair values to hypothetical
changes in primary mortgage rates. This sensitivity analysis does not reflect an expected outcome. Refer to the
“Mortgage Servicing Rights” discussion in the “Balance Sheet” analysis section found later in this report.
Income Taxes
Accrued income taxes are reported as a component of either other assets or other liabilities, as appropriate,
in the consolidated balance sheets and reflect management’s estimate of income taxes to be paid or received.
Deferred income taxes represent the amount of future income taxes to be paid or received and are accounted
for using the asset and liability method. The net balance is reported in other assets in the consolidated balance
sheets. The Company determines the realization of the deferred tax asset based upon an evaluation of the four
possible sources of taxable income: 1) the future reversals of taxable temporary differences; 2) future taxable
income exclusive of reversing temporary differences and carryforwards; 3) taxable income in prior carryback
years; and 4) tax-planning strategies. In projecting future taxable income, the Company utilizes forecasted
pre-tax earnings, adjusts for the estimated book-tax differences and incorporates assumptions, including the
amounts of income allocable to taxing jurisdictions. These assumptions require significant judgment and are
consistent with the plans and estimates the Company uses to manage the underlying businesses. The realization
of the deferred tax assets could be reduced in the future if these estimates are significantly different than
forecasted. For a detailed discussion of realization of deferred tax assets, refer to the “Income Taxes” section
found later in this report.
The Company is subject to income tax in the U.S. and multiple state and local jurisdictions. The tax laws
and regulations in each jurisdiction may be interpreted differently in certain situations, which could result in a
64