Regions Bank 2011 Annual Report Download - page 6
Download and view the complete annual report
Please find page 6 of the 2011 Regions Bank annual report below. You can navigate through the pages in the report by either clicking on the pages listed below, or by using the keyword search tool below to find specific information within the annual report.-
 1
1 -
 2
2 -
 3
3 -
 4
4 -
 5
5 -
 6
6 -
 7
7 -
 8
8 -
 9
9 -
 10
10 -
 11
11 -
 12
12 -
 13
13 -
 14
14 -
 15
15 -
 16
16 -
 17
17 -
18
-
19
-
20
-
21
-
22
-
23
-
24
-
25
-
26
-
27
-
28
-
29
-
30
-
31
-
32
-
33
-
34
-
35
-
36
-
37
-
38
-
39
-
40
-
41
-
42
-
43
-
44
-
45
-
46
-
47
-
48
-
49
-
50
-
51
-
52
-
53
-
54
-
55
-
56
-
57
-
58
-
59
-
60
-
61
-
62
-
63
-
64
-
65
-
66
-
67
-
68
-
69
-
70
-
71
-
72
-
73
-
74
-
75
-
76
-
77
-
78
-
79
-
80
-
81
-
82
-
83
-
84
-
85
-
86
-
87
-
88
-
89
-
90
-
91
-
92
-
93
-
94
-
95
-
96
-
97
-
98
-
99
-
100
-
101
-
102
-
103
-
104
-
105
-
106
-
107
-
108
-
109
-
110
-
111
-
112
-
113
-
114
-
115
-
116
-
117
-
118
-
119
-
120
-
121
-
122
-
123
-
124
-
125
-
126
-
127
-
128
-
129
-
130
-
131
-
132
-
133
-
134
-
135
-
136
-
137
-
138
-
139
-
140
-
141
-
142
-
143
-
144
-
145
-
146
-
147
-
148
-
149
-
150
-
151
-
152
-
153
-
154
-
155
-
156
-
157
-
158
-
159
-
160
-
161
-
162
-
163
-
164
-
165
-
166
-
167
-
168
-
169
-
170
-
171
-
172
-
173
-
174
-
175
-
176
-
177
-
178
-
179
-
180
-
181
-
182
-
183
-
184
-
185
-
186
-
187
-
188
-
189
-
190
-
191
-
192
-
193
-
194
-
195
-
196
-
197
-
198
-
199
-
200
-
201
-
202
-
203
-
204
-
205
-
206
-
207
-
208
-
209
-
210
-
211
-
212
-
213
-
214
-
215
-
216
-
217
-
218
-
219
-
220
-
221
-
222
-
223
-
224
-
225
-
226
-
227
-
228
-
229
-
230
-
231
-
232
-
233
-
234
-
235
-
236
-
237
-
238
-
239
-
240
-
241
-
242
-
243
-
244
-
245
-
246
-
247
-
248
-
249
-
250
-
251
-
252
-
253
-
254
-
255
-
256
-
257
-
258
-
259
-
260
-
261
-
262
-
263
-
264
-
265
-
266
-
267
-
268
 |
 |

REGIONS 2011 ANNUAL REPORT4
Each of these priorities includes a plan to mea-
sure performance – this is an integral part of our
corporate culture and key to our future growth.
We believe teams perform best when all players
understand their roles and have accountabil-
ity for what they accomplish both individually
and collectively.
Strengthen Financial Performance
Our 2011 results refl ected our priority of strength-
ening fi nancial performance. Adjusted pre-tax
pre-provision income2, or PPI, totaled $1.9 bil-
lion, excluding securities transactions, leveraged
lease terminations, branch consolidation costs
and other property charges and goodwill impair-
ment. This is an increase of 11% compared to
the prior year. Our associates delivered these
results and many more during a year where
headwinds challenged the way we operate and
the banking environment continued to evolve.
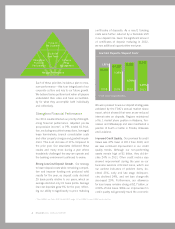
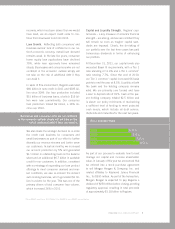
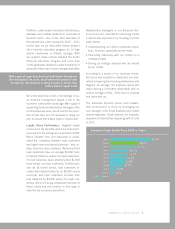
Strong Low Cost Deposit Growth. Our strategy
to lower deposit costs while remaining competi-
tive and improve funding mix produced solid
results for the year, as deposit costs declined
29 basis points relative to our peers, which on
average declined only 21 basis points. Average
low cost deposits grew 6% for the year, refl ect-
ing our ability to signifi cantly re-price maturing
certifi cates of deposits. As a result, funding
costs were further reduced by a favorable shift
in our deposit mix. Given the signifi cant amount
of certifi cates of deposit maturing in 2012,
we see additional opportunities next year.
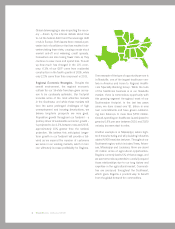
We were pleased to see our deposit strategy was
validated by the FDIC’s annual market share
report, which showed that even as we reduced
interest rates on deposits, Regions maintained
a No. 1 market share position in Alabama, Ten-
nessee and Mississippi and also maintained a
position of fourth or better in Florida, Arkansas
and Louisiana.
Improved Credit Quality. Our provision for credit
losses was 47% lower in 2011 than 2010, and
we saw continued improvement in our credit
quality trends. Although our non-performing
assets remain high at $3 billion, they did de-
cline 24% in 2011. Other credit metrics also
showed improvement during the year as our
business services criticized loans, which are
our earliest indicators of problem loans, de-
clined 35%, early and late stage delinquen-
cies declined 24%, and net loan charge-offs
decreased 29%. Furthermore, our allowance
for loan losses remains strong at $2.7 billion, or
3.54% of total loans. While our improvement in
credit quality will generally track the economic
Low Cost Deposits / Deposit Costs*
67,125 71,813 76,244
2008 2009 2010 2011
1.91%
1.35%
0.78%
0.49%
58,425
*From continuing operations
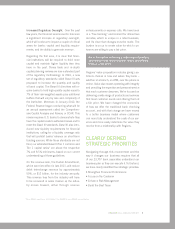
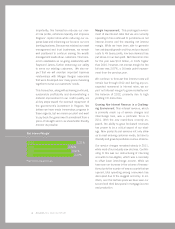
Focus on
the Customer
Manage Performance
Build the
Best Team
Strengthen
Financial
Performance
Enhance
Risk
Management
2 Non-GAAP, see Form 8-K Exhibit 99.2 page 10 for GAAP to non-GAAP reconciliation