Regions Bank 2011 Annual Report Download - page 196
Download and view the complete annual report
Please find page 196 of the 2011 Regions Bank annual report below. You can navigate through the pages in the report by either clicking on the pages listed below, or by using the keyword search tool below to find specific information within the annual report.-
 1
1 -
2
-
3
-
4
-
5
-
6
-
7
-
8
-
9
-
10
-
11
-
12
-
13
-
14
-
15
-
16
-
17
-
18
-
19
-
20
-
21
-
22
-
23
-
24
-
25
-
26
-
27
-
28
-
29
-
30
-
31
-
32
-
33
-
34
-
35
-
36
-
37
-
38
-
39
-
40
-
41
-
42
-
43
-
44
-
45
-
46
-
47
-
48
-
49
-
50
-
51
-
52
-
53
-
54
-
55
-
56
-
57
-
58
-
59
-
60
-
61
-
62
-
63
-
64
-
65
-
66
-
67
-
68
-
69
-
70
-
71
-
72
-
73
-
74
-
75
-
76
-
77
-
78
-
79
-
80
-
81
-
82
-
83
-
84
-
85
-
86
-
87
-
88
-
89
-
90
-
91
-
92
-
93
-
94
-
95
-
96
-
97
-
98
-
99
-
100
-
101
-
102
-
103
-
104
-
105
-
106
-
107
-
108
-
109
-
110
-
111
-
112
-
113
-
114
-
115
-
116
-
117
-
118
-
119
-
120
-
121
-
122
-
123
-
124
-
125
-
126
-
127
-
128
-
129
-
130
-
131
-
132
-
133
-
134
-
135
-
136
-
137
-
138
-
139
-
140
-
141
-
142
-
143
-
144
-
145
-
146
-
147
-
148
-
149
-
150
-
151
-
152
-
153
-
154
-
155
-
156
-
157
-
158
-
159
-
160
-
161
-
162
-
163
-
164
-
165
-
166
-
167
-
168
-
169
-
170
-
171
-
172
-
173
-
174
-
175
-
176
-
177
-
178
-
179
-
180
-
181
-
182
-
183
-
184
-
185
-
 186
186 -
 187
187 -
 188
188 -
 189
189 -
 190
190 -
 191
191 -
 192
192 -
 193
193 -
 194
194 -
 195
195 -
 196
196 -
 197
197 -
 198
198 -
 199
199 -
 200
200 -
 201
201 -
 202
202 -
 203
203 -
 204
204 -
 205
205 -
 206
206 -
207
-
208
-
209
-
210
-
211
-
212
-
213
-
214
-
215
-
216
-
217
-
218
-
219
-
220
-
221
-
222
-
223
-
224
-
225
-
226
-
227
-
228
-
229
-
230
-
231
-
232
-
233
-
234
-
235
-
236
-
237
-
238
-
239
-
240
-
241
-
242
-
243
-
244
-
245
-
246
-
247
-
248
-
249
-
250
-
251
-
252
-
253
-
254
-
255
-
256
-
257
-
258
-
259
-
260
-
261
-
262
-
263
-
264
-
265
-
266
-
267
-
268
 |
 |

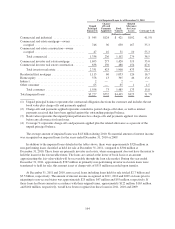
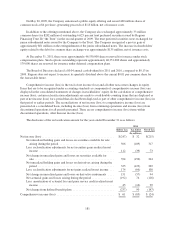
estimate determined by the Company and meant to compensate for the risk inherent in the future cash flow
projections and inherent differences (such as business model and market perception of risk) between Regions and
the peer set.
Regions uses the public company method and the transaction method as the two market approaches. The
public company method applies a value multiplier derived from each reporting unit’s peer group to a financial
metric of the reporting unit (e.g. last twelve months of earnings before interest, taxes and depreciation, tangible
book value, etc.) and control premium to the respective reporting unit. The control premium is evaluated and
compared to similar financial services transactions considering the absolute and relative potential revenue
synergies and cost savings. The transaction method applies a value multiplier to a financial metric of the
reporting unit based on comparable observed purchase transactions in the financial services industry for the
reporting unit (where available).
Regions uses the output from these approaches to determine the estimated fair value of each reporting unit.
Listed in the tables below are assumptions used in estimating the fair value of each reporting unit. The tables
include the discount rate used in the income approach, the market multiplier used in the market approaches, and
the public company method control premium applied to all reporting units.
As of Fourth Quarter 2011
Banking/
Treasury
Investment
Banking/
Brokerage/Trust Insurance
Discount rate used in income approach ......................... 15% 15% 11%
Public company method market multiplier(1) ..................... 0.7x 1.4x 13.0x
Transaction method market multiplier(2) ........................ 1.1x 1.5x n/a
(1) For the Banking/Treasury and Investment Banking/Brokerage/Trust reporting units, these multipliers are
applied to tangible book value. For the Insurance reporting unit, this multiplier is applied to the last twelve
months of net income. In addition to the multipliers, a 55 percent control premium is assumed for the
Banking/Treasury reporting unit. A 20 percent control premium is assumed for the Investment Banking/
Brokerage/Trust reporting unit and a 30 percent control premium for the Insurance reporting unit.
(2) For the Banking/Treasury and Investment Banking/Brokerage/Trust reporting units, these multipliers are
applied to tangible book value.
As of Fourth Quarter 2010
Banking/
Treasury
Investment
Banking/
Brokerage/
Trust Insurance
Discount rate used in income approach .......................... 15% 14% 11%
Public company method market multiplier(1) ...................... 1.0x 1.6x 17.3x
Transaction method market multiplier(2) ......................... 1.3x 2.1x n/a
(1) For the Banking/Treasury and Investment Banking/Brokerage/Trust reporting units, these multipliers are
applied to tangible book value. For the Insurance reporting unit, this multiplier is applied to the last twelve
months of net income. In addition to the multipliers, a 30 percent control premium is assumed for each
reporting unit.
(2) For the Banking/Treasury and Investment Banking/Brokerage/Trust reporting units, these multipliers are
applied to tangible book value.
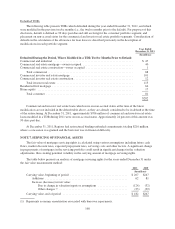
In the latter half of 2011, Regions experienced a significant decline in market capitalization relative to prior
periods. The large-cap banking sector also experienced a decline in market capitalization albeit not as significant
as that of Regions. This resulted in price-to-tangible book values declining and resulted in an overall value
conclusion for the Banking/Treasury reporting unit that would be indicative of a distressed sale in the public
company method. Accordingly, Regions increased the control premium utilized in that method from 30 percent
used in 2010 to 55 percent in the test conducted in the fourth quarter of 2011.
172