Regions Bank 2011 Annual Report Download - page 241
Download and view the complete annual report
Please find page 241 of the 2011 Regions Bank annual report below. You can navigate through the pages in the report by either clicking on the pages listed below, or by using the keyword search tool below to find specific information within the annual report.-
 1
1 -
2
-
3
-
4
-
5
-
6
-
7
-
8
-
9
-
10
-
11
-
12
-
13
-
14
-
15
-
16
-
17
-
18
-
19
-
20
-
21
-
22
-
23
-
24
-
25
-
26
-
27
-
28
-
29
-
30
-
31
-
32
-
33
-
34
-
35
-
36
-
37
-
38
-
39
-
40
-
41
-
42
-
43
-
44
-
45
-
46
-
47
-
48
-
49
-
50
-
51
-
52
-
53
-
54
-
55
-
56
-
57
-
58
-
59
-
60
-
61
-
62
-
63
-
64
-
65
-
66
-
67
-
68
-
69
-
70
-
71
-
72
-
73
-
74
-
75
-
76
-
77
-
78
-
79
-
80
-
81
-
82
-
83
-
84
-
85
-
86
-
87
-
88
-
89
-
90
-
91
-
92
-
93
-
94
-
95
-
96
-
97
-
98
-
99
-
100
-
101
-
102
-
103
-
104
-
105
-
106
-
107
-
108
-
109
-
110
-
111
-
112
-
113
-
114
-
115
-
116
-
117
-
118
-
119
-
120
-
121
-
122
-
123
-
124
-
125
-
126
-
127
-
128
-
129
-
130
-
131
-
132
-
133
-
134
-
135
-
136
-
137
-
138
-
139
-
140
-
141
-
142
-
143
-
144
-
145
-
146
-
147
-
148
-
149
-
150
-
151
-
152
-
153
-
154
-
155
-
156
-
157
-
158
-
159
-
160
-
161
-
162
-
163
-
164
-
165
-
166
-
167
-
168
-
169
-
170
-
171
-
172
-
173
-
174
-
175
-
176
-
177
-
178
-
179
-
180
-
181
-
182
-
183
-
184
-
185
-
186
-
187
-
188
-
189
-
190
-
191
-
192
-
193
-
194
-
195
-
196
-
197
-
198
-
199
-
200
-
201
-
202
-
203
-
204
-
205
-
206
-
207
-
208
-
209
-
210
-
211
-
212
-
213
-
214
-
215
-
216
-
217
-
218
-
219
-
220
-
221
-
222
-
223
-
224
-
225
-
226
-
227
-
228
-
229
-
230
-
 231
231 -
 232
232 -
 233
233 -
 234
234 -
 235
235 -
 236
236 -
 237
237 -
 238
238 -
 239
239 -
 240
240 -
 241
241 -
 242
242 -
 243
243 -
 244
244 -
 245
245 -
 246
246 -
 247
247 -
 248
248 -
 249
249 -
 250
250 -
 251
251 -
252
-
253
-
254
-
255
-
256
-
257
-
258
-
259
-
260
-
261
-
262
-
263
-
264
-
265
-
266
-
267
-
268
 |
 |

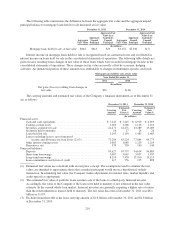
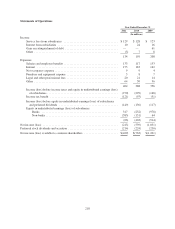
NOTE 24. PARENT COMPANY ONLY FINANCIAL STATEMENTS
Presented below are condensed financial statements of Regions Financial Corporation:
Balance Sheets
December 31
2011 2010
ASSETS (In millions)
Interest-bearing deposits in other banks .......................................... $ 2,497 $ 3,848
Loans to subsidiaries ......................................................... 1 36
Securities available for sale .................................................... 31 36
Trading assets .............................................................. 20 26
Premises and equipment ...................................................... 25 65
Investments in subsidiaries:
Banks ................................................................. 16,436 15,719
Non-banks ............................................................. 1,188 1,670
17,624 17,389
Other assets ................................................................ 405 380
Total assets ........................................................ $20,603 $21,780
LIABILITIES AND STOCKHOLDERS’ EQUITY
Long-term borrowings ........................................................ $ 3,887 $ 4,907
Other liabilities ............................................................. 217 139
Total liabilities ..................................................... 4,104 5,046
Stockholders’ equity:
Preferred stock .......................................................... 3,419 3,380
Common stock .......................................................... 13 13
Additional paid-in capital ................................................. 19,060 19,050
Retained earnings (deficit) ................................................ (4,527) (4,047)
Treasury stock .......................................................... (1,397) (1,402)
Accumulated other comprehensive loss ...................................... (69) (260)
Total stockholders’ equity ............................................. 16,499 16,734
Total liabilities and stockholders’ equity ............................. $20,603 $21,780
217