Regions Bank 2011 Annual Report Download - page 70
Download and view the complete annual report
Please find page 70 of the 2011 Regions Bank annual report below. You can navigate through the pages in the report by either clicking on the pages listed below, or by using the keyword search tool below to find specific information within the annual report.-
 1
1 -
2
-
3
-
4
-
5
-
6
-
7
-
8
-
9
-
10
-
11
-
12
-
13
-
14
-
15
-
16
-
17
-
18
-
19
-
20
-
21
-
22
-
23
-
24
-
25
-
26
-
27
-
28
-
29
-
30
-
31
-
32
-
33
-
34
-
35
-
36
-
37
-
38
-
39
-
40
-
41
-
42
-
43
-
44
-
45
-
46
-
47
-
48
-
49
-
50
-
51
-
52
-
53
-
54
-
55
-
56
-
57
-
58
-
59
-
 60
60 -
 61
61 -
 62
62 -
 63
63 -
 64
64 -
 65
65 -
 66
66 -
 67
67 -
 68
68 -
 69
69 -
 70
70 -
 71
71 -
 72
72 -
 73
73 -
 74
74 -
 75
75 -
 76
76 -
 77
77 -
 78
78 -
 79
79 -
 80
80 -
81
-
82
-
83
-
84
-
85
-
86
-
87
-
88
-
89
-
90
-
91
-
92
-
93
-
94
-
95
-
96
-
97
-
98
-
99
-
100
-
101
-
102
-
103
-
104
-
105
-
106
-
107
-
108
-
109
-
110
-
111
-
112
-
113
-
114
-
115
-
116
-
117
-
118
-
119
-
120
-
121
-
122
-
123
-
124
-
125
-
126
-
127
-
128
-
129
-
130
-
131
-
132
-
133
-
134
-
135
-
136
-
137
-
138
-
139
-
140
-
141
-
142
-
143
-
144
-
145
-
146
-
147
-
148
-
149
-
150
-
151
-
152
-
153
-
154
-
155
-
156
-
157
-
158
-
159
-
160
-
161
-
162
-
163
-
164
-
165
-
166
-
167
-
168
-
169
-
170
-
171
-
172
-
173
-
174
-
175
-
176
-
177
-
178
-
179
-
180
-
181
-
182
-
183
-
184
-
185
-
186
-
187
-
188
-
189
-
190
-
191
-
192
-
193
-
194
-
195
-
196
-
197
-
198
-
199
-
200
-
201
-
202
-
203
-
204
-
205
-
206
-
207
-
208
-
209
-
210
-
211
-
212
-
213
-
214
-
215
-
216
-
217
-
218
-
219
-
220
-
221
-
222
-
223
-
224
-
225
-
226
-
227
-
228
-
229
-
230
-
231
-
232
-
233
-
234
-
235
-
236
-
237
-
238
-
239
-
240
-
241
-
242
-
243
-
244
-
245
-
246
-
247
-
248
-
249
-
250
-
251
-
252
-
253
-
254
-
255
-
256
-
257
-
258
-
259
-
260
-
261
-
262
-
263
-
264
-
265
-
266
-
267
-
268
 |
 |
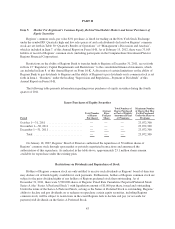
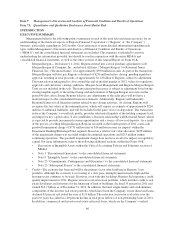
Item 7. Management’s Discussion and Analysis of Financial Condition and Results of Operations
Item 7A. Quantitative and Qualitative Disclosures about Market Risk
INTRODUCTION
EXECUTIVE SUMMARY
Management believes the following points summarize several of the most relevant items necessary for an
understanding of the financial aspects of Regions Financial Corporation’s (“Regions” or “the Company”)
business, particularly regarding its 2011 results. Cross references to more detailed information regarding each
topic within Management’s Discussion and Analysis of Financial Condition and Results of Operations
(“MD&A”) and the consolidated financial statements are included. This summary is intended to assist in
understanding the information provided, but should be read in conjunction with the entire MD&A and
consolidated financial statements, as well as the other sections of this Annual Report on Form 10-K.
• Morgan Keegan— On January 11, 2012, Regions entered into a stock purchase agreement to sell
Morgan Keegan & Company, Inc. and related affiliates (“Morgan Keegan”) to Raymond James
Financial, Inc. (“Raymond James”) for approximately $930 million in cash. As part of the transaction,
Morgan Keegan will also pay Regions a dividend of $250 million before closing, pending regulatory
approval, resulting in total proceeds of approximately $1.18 billion to Regions, subject to adjustment.
The transaction is anticipated to close around the end of the first quarter of 2012, subject to regulatory
approvals and customary closing conditions. Morgan Asset Management and Regions Morgan Keegan
Trust are not included in the sale. The transaction purchase price is subject to adjustment based on the
closing tangible equity of the entities being sold and retention of Morgan Keegan associates in the
period 90 days after closing. Regions believes any adjustments to the sales price will not have a
material impact to the consolidated financial statements. Additionally, Regions will indemnify
Raymond James for all litigation matters related to pre-closing activities. At closing, Regions will
recognize the fair values of the indemnification, which will require an estimate of approximately $210
million of additional liabilities, and will be included in the gain / (loss) on disposition. The transaction
reduces the Company’s overall risk profile, provides substantial liquidity at the holding company level,
and improves key capital ratios. It also establishes a business relationship with Raymond James, which
is expected to provide incremental revenue opportunities and a source of low-cost deposits. As a result
of the process of selling Morgan Keegan, Regions recorded in the fourth quarter of 2011 a non-cash
goodwill impairment charge of $731 million (net of $14 million income tax impact) within the
Investment Banking/Brokerage/Trust segment. Based on a relative fair value allocation, $478 million
of the impairment charge was recorded within discontinued operations and $253 million within
continuing operations. The goodwill impairment charge does not have an adverse impact on regulatory
capital. For more information, refer to the following additional sections within this Form 10-K:
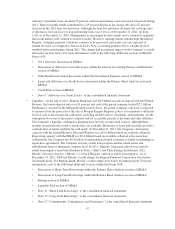
• Discussion of Intangible Assets within the Critical Accounting Policies and Estimates section of
MD&A
• Note 3 “Discontinued Operations” to the consolidated financial statements
• Note 9 “Intangible Assets” to the consolidated financial statements
• Note 23 “Commitments, Contingencies and Guarantees” to the consolidated financial statements
• Note 25 “Subsequent Events” to the consolidated financial statements
• Credit—The economy has been and will be the primary factor which influences Regions’ loan
portfolio. Although the economy is recovering at a slow pace, unemployment remains high and the
housing sector continues to be weak. However, even with this backdrop, Regions did experience credit
quality improvement in 2011. Regions’ investor real estate loan portfolio, which includes credit to real
estate developers and investors for the financing of land or buildings, declined 33 percent in 2011 and
totaled $10.7 billion as of December 31, 2011. In addition, the land, single-family and condominium
components of the investor real estate portfolio, which have been the Company’s most distressed loans,
declined 43 percent and ended the year at $1.8 billion. The reduction in investor real estate over the
past few years has aided in a 40 percent decline in total gross inflows of non-performing loans in 2011.
In addition, commercial and investor real estate criticized loans, which are the Company’s earliest
46