Regions Bank 2011 Annual Report Download - page 99
Download and view the complete annual report
Please find page 99 of the 2011 Regions Bank annual report below. You can navigate through the pages in the report by either clicking on the pages listed below, or by using the keyword search tool below to find specific information within the annual report.-
 1
1 -
2
-
3
-
4
-
5
-
6
-
7
-
8
-
9
-
10
-
11
-
12
-
13
-
14
-
15
-
16
-
17
-
18
-
19
-
20
-
21
-
22
-
23
-
24
-
25
-
26
-
27
-
28
-
29
-
30
-
31
-
32
-
33
-
34
-
35
-
36
-
37
-
38
-
39
-
40
-
41
-
42
-
43
-
44
-
45
-
46
-
47
-
48
-
49
-
50
-
51
-
52
-
53
-
54
-
55
-
56
-
57
-
58
-
59
-
60
-
61
-
62
-
63
-
64
-
65
-
66
-
67
-
68
-
69
-
70
-
71
-
72
-
73
-
74
-
75
-
76
-
77
-
78
-
79
-
80
-
81
-
82
-
83
-
84
-
85
-
86
-
87
-
88
-
 89
89 -
 90
90 -
 91
91 -
 92
92 -
 93
93 -
 94
94 -
 95
95 -
 96
96 -
 97
97 -
 98
98 -
 99
99 -
 100
100 -
 101
101 -
 102
102 -
 103
103 -
 104
104 -
 105
105 -
 106
106 -
 107
107 -
 108
108 -
 109
109 -
110
-
111
-
112
-
113
-
114
-
115
-
116
-
117
-
118
-
119
-
120
-
121
-
122
-
123
-
124
-
125
-
126
-
127
-
128
-
129
-
130
-
131
-
132
-
133
-
134
-
135
-
136
-
137
-
138
-
139
-
140
-
141
-
142
-
143
-
144
-
145
-
146
-
147
-
148
-
149
-
150
-
151
-
152
-
153
-
154
-
155
-
156
-
157
-
158
-
159
-
160
-
161
-
162
-
163
-
164
-
165
-
166
-
167
-
168
-
169
-
170
-
171
-
172
-
173
-
174
-
175
-
176
-
177
-
178
-
179
-
180
-
181
-
182
-
183
-
184
-
185
-
186
-
187
-
188
-
189
-
190
-
191
-
192
-
193
-
194
-
195
-
196
-
197
-
198
-
199
-
200
-
201
-
202
-
203
-
204
-
205
-
206
-
207
-
208
-
209
-
210
-
211
-
212
-
213
-
214
-
215
-
216
-
217
-
218
-
219
-
220
-
221
-
222
-
223
-
224
-
225
-
226
-
227
-
228
-
229
-
230
-
231
-
232
-
233
-
234
-
235
-
236
-
237
-
238
-
239
-
240
-
241
-
242
-
243
-
244
-
245
-
246
-
247
-
248
-
249
-
250
-
251
-
252
-
253
-
254
-
255
-
256
-
257
-
258
-
259
-
260
-
261
-
262
-
263
-
264
-
265
-
266
-
267
-
268
 |
 |
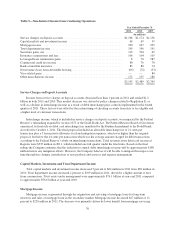
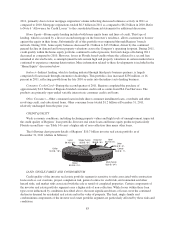
Branch Consolidation and Property and Equipment Charges
Non-interest expense in 2011 included $75 million of branch consolidation charges related to lower of cost
or market adjustments on owned branch property, terminated ground leases and impairment of other equipment.
The charges were driven primarily by Regions’ decision to consolidate approximately 40 branches. Regions
expects to realize future net cost savings of approximately $19 million on an annual basis as a result of the
consolidations.
FDIC Premiums
FDIC premiums decreased in 2011 by $3 million to $217 million. FDIC premiums were impacted by a new
assessment rule in 2011, which revised the deposit insurance assessment system for large institutions. The new
rule changed the assessment base from deposits as the basis and utilizes a risk-based approach which calculates
the assessment using average consolidated assets minus average tangible equity. Implementation of the new rule
was effective beginning in the second quarter of 2011. The bank regulatory agencies’ ratings, comprised of
Regions Bank’s capital, asset quality, management, earnings, liquidity and sensitivity to risk, along with certain
financial ratios are used in determining FDIC insurance premiums. For further information, see discussion of
Deposit Insurance in the Supervision and Regulation section of Item 1 of this Form 10-K.
Loss on Early Extinguishment of Debt
During 2010, Regions prepaid approximately $2.0 billion of FHLB advances, realizing a $108 million
pre-tax loss on early extinguishment. These extinguishments were part of the Company’s asset/liability
management process.
Regulatory Charge
During the second quarter of 2010, the SEC, a joint state task force of state securities regulators and FINRA
announced that they were commencing administrative proceedings against Morgan Keegan, Morgan Asset
Management and certain of their employees for violations of federal and state securities laws and NASD rules
relating to certain mutual funds previously administered by Morgan Keegan and Morgan Asset Management.
Based on the status of settlement negotiations, Regions concluded that a loss on the matter was probable and
reasonably estimable. Accordingly, at June 30, 2010, Regions recorded a $200 million charge representing the
estimate of probable loss. Of this amount, $75 million was from continuing operations and $125 million was
from discontinued operations. The charges were settled during the second quarter of 2011.
Goodwill Impairment
As a result of the process of selling Morgan Keegan, Regions’ 2011 results include a non-cash goodwill
impairment charge of $731 million (net of $14 million income tax impact) within the investment banking/
brokerage/trust segment. Based on a relative fair value allocation, $478 million was recorded within discontinued
operations and $253 million within continuing operations. The goodwill impairment charge is a non-cash item
which does not have an adverse impact on regulatory capital. Refer to Note 9 in the footnotes to the consolidated
financial statements for further details.
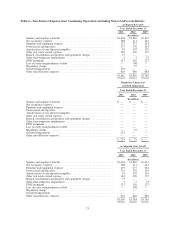
Other Miscellaneous Expenses
Other miscellaneous expenses include communications, postage, supplies, credit-related costs and business
development services. Other miscellaneous expenses decreased $24 million to $616 million in 2011, reflecting
the Company controlling discretionary costs.
75