Regions Bank 2011 Annual Report Download - page 92
Download and view the complete annual report
Please find page 92 of the 2011 Regions Bank annual report below. You can navigate through the pages in the report by either clicking on the pages listed below, or by using the keyword search tool below to find specific information within the annual report.-
 1
1 -
2
-
3
-
4
-
5
-
6
-
7
-
8
-
9
-
10
-
11
-
12
-
13
-
14
-
15
-
16
-
17
-
18
-
19
-
20
-
21
-
22
-
23
-
24
-
25
-
26
-
27
-
28
-
29
-
30
-
31
-
32
-
33
-
34
-
35
-
36
-
37
-
38
-
39
-
40
-
41
-
42
-
43
-
44
-
45
-
46
-
47
-
48
-
49
-
50
-
51
-
52
-
53
-
54
-
55
-
56
-
57
-
58
-
59
-
60
-
61
-
62
-
63
-
64
-
65
-
66
-
67
-
68
-
69
-
70
-
71
-
72
-
73
-
74
-
75
-
76
-
77
-
78
-
79
-
80
-
81
-
 82
82 -
 83
83 -
 84
84 -
 85
85 -
 86
86 -
 87
87 -
 88
88 -
 89
89 -
 90
90 -
 91
91 -
 92
92 -
 93
93 -
 94
94 -
 95
95 -
 96
96 -
 97
97 -
 98
98 -
 99
99 -
 100
100 -
 101
101 -
 102
102 -
103
-
104
-
105
-
106
-
107
-
108
-
109
-
110
-
111
-
112
-
113
-
114
-
115
-
116
-
117
-
118
-
119
-
120
-
121
-
122
-
123
-
124
-
125
-
126
-
127
-
128
-
129
-
130
-
131
-
132
-
133
-
134
-
135
-
136
-
137
-
138
-
139
-
140
-
141
-
142
-
143
-
144
-
145
-
146
-
147
-
148
-
149
-
150
-
151
-
152
-
153
-
154
-
155
-
156
-
157
-
158
-
159
-
160
-
161
-
162
-
163
-
164
-
165
-
166
-
167
-
168
-
169
-
170
-
171
-
172
-
173
-
174
-
175
-
176
-
177
-
178
-
179
-
180
-
181
-
182
-
183
-
184
-
185
-
186
-
187
-
188
-
189
-
190
-
191
-
192
-
193
-
194
-
195
-
196
-
197
-
198
-
199
-
200
-
201
-
202
-
203
-
204
-
205
-
206
-
207
-
208
-
209
-
210
-
211
-
212
-
213
-
214
-
215
-
216
-
217
-
218
-
219
-
220
-
221
-
222
-
223
-
224
-
225
-
226
-
227
-
228
-
229
-
230
-
231
-
232
-
233
-
234
-
235
-
236
-
237
-
238
-
239
-
240
-
241
-
242
-
243
-
244
-
245
-
246
-
247
-
248
-
249
-
250
-
251
-
252
-
253
-
254
-
255
-
256
-
257
-
258
-
259
-
260
-
261
-
262
-
263
-
264
-
265
-
266
-
267
-
268
 |
 |

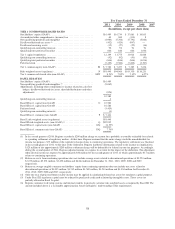
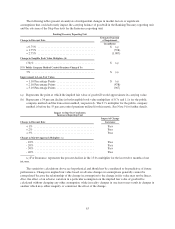
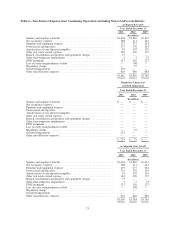
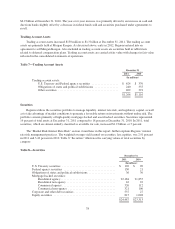
Table 4—Volume and Yield/Rate Variances for Continuing Operations
2011 Compared to 2010 2010 Compared to 2009
Change Due to Change Due to
Volume
Yield/
Rate Net Volume
Yield/
Rate Net
(Taxable equivalent basis – in millions)
Interest income on:
Federal funds sold and securities purchased under agreements
to resell ......................................... $ (1) $ (1) $ (2) $— $ 2 $ 2
Trading account assets ............................... — (3) (3) (14) (4) (18)
Securities:
Taxable ....................................... 26 (141) (115) 156 (249) (93)
Tax-exempt .................................... — (1) (1) (16) (12) (28)
Loans held for sale .................................. (5) 1 (4) (12) (4) (16)
Loans, net of unearned income ......................... (258) 1 (257) (342) (142) (484)
Other interest-earning assets ........................... 1 (1) — (4) 1 (3)
Total interest-earning assets ........................... (237) (145) (382) (232) (408) (640)
Interest expense on:
Savings accounts .................................... 1 — 1 1 (2) (1)
Interest-bearing transaction accounts .................... 3 (8) (5) — (8) (8)
Money market accounts—domestic ..................... (7) (37) (44) 38 (103) (65)
Money market accounts—foreign ...................... — — — (1) (1) (2)
Time deposits—customer ............................. (95) (139) (234) (181) (263) (444)
Total customer deposits—interest-bearing ............ (98) (184) (282) (143) (377) (520)
Time deposits—non customer ......................... — (1) (1) (1) — (1)
Other foreign deposits ............................... — — — (1) — (1)
Total treasury deposits—interest-bearing ............. — (1) (1) (2) — (2)
Total interest-bearing deposits ................. (98) (185) (283) (145) (377) (522)
Federal funds purchased and securities sold under agreements
to repurchase ..................................... — (4) (4) (2) (3) (5)
Other short-term borrowings .......................... — (1) (1) (21) (14) (35)
Long-term borrowings ............................... (140) 22 (118) (101) (73) (174)
Total interest-bearing liabilities ........................ (238) (168) (406) (269) (467) (736)
Increase in net interest income ......................... $ 1 $ 23 $ 24 $ 37 $ 59 $ 96
Notes:
1. The change in interest not due solely to volume or yield/rate has been allocated to the volume column and
yield/rate column in proportion to the relationship of the absolute dollar amounts of the change in each.
2. The computation of taxable-equivalent net interest income is based on the statutory federal income tax rate
of 35 percent, adjusted for applicable state income taxes net of the related federal tax benefit.
3. The table above does not include average assets, average liabilities, interest income or interest expense for
discontinued operations (see Note 3 to the consolidated financial statements).
Net interest income and interest-rate spread are also affected by the actions taken to manage interest rate
risk. As described in the “Market Risk-Interest Rate Risk” section of MD&A, Regions employs multiple tools in
order to manage the risk of variability in net interest income attributable to changes in interest rates. Among
these tools are interest rate derivatives. In 2011, net interest income attributable to interest rate derivatives for
hedging purposes was $362 million versus $515 million in 2010.
68