Regions Bank 2011 Annual Report Download - page 126
Download and view the complete annual report
Please find page 126 of the 2011 Regions Bank annual report below. You can navigate through the pages in the report by either clicking on the pages listed below, or by using the keyword search tool below to find specific information within the annual report.-
 1
1 -
2
-
3
-
4
-
5
-
6
-
7
-
8
-
9
-
10
-
11
-
12
-
13
-
14
-
15
-
16
-
17
-
18
-
19
-
20
-
21
-
22
-
23
-
24
-
25
-
26
-
27
-
28
-
29
-
30
-
31
-
32
-
33
-
34
-
35
-
36
-
37
-
38
-
39
-
40
-
41
-
42
-
43
-
44
-
45
-
46
-
47
-
48
-
49
-
50
-
51
-
52
-
53
-
54
-
55
-
56
-
57
-
58
-
59
-
60
-
61
-
62
-
63
-
64
-
65
-
66
-
67
-
68
-
69
-
70
-
71
-
72
-
73
-
74
-
75
-
76
-
77
-
78
-
79
-
80
-
81
-
82
-
83
-
84
-
85
-
86
-
87
-
88
-
89
-
90
-
91
-
92
-
93
-
94
-
95
-
96
-
97
-
98
-
99
-
100
-
101
-
102
-
103
-
104
-
105
-
106
-
107
-
108
-
109
-
110
-
111
-
112
-
113
-
114
-
115
-
 116
116 -
 117
117 -
 118
118 -
 119
119 -
 120
120 -
 121
121 -
 122
122 -
 123
123 -
 124
124 -
 125
125 -
 126
126 -
 127
127 -
 128
128 -
 129
129 -
 130
130 -
 131
131 -
 132
132 -
 133
133 -
 134
134 -
 135
135 -
 136
136 -
137
-
138
-
139
-
140
-
141
-
142
-
143
-
144
-
145
-
146
-
147
-
148
-
149
-
150
-
151
-
152
-
153
-
154
-
155
-
156
-
157
-
158
-
159
-
160
-
161
-
162
-
163
-
164
-
165
-
166
-
167
-
168
-
169
-
170
-
171
-
172
-
173
-
174
-
175
-
176
-
177
-
178
-
179
-
180
-
181
-
182
-
183
-
184
-
185
-
186
-
187
-
188
-
189
-
190
-
191
-
192
-
193
-
194
-
195
-
196
-
197
-
198
-
199
-
200
-
201
-
202
-
203
-
204
-
205
-
206
-
207
-
208
-
209
-
210
-
211
-
212
-
213
-
214
-
215
-
216
-
217
-
218
-
219
-
220
-
221
-
222
-
223
-
224
-
225
-
226
-
227
-
228
-
229
-
230
-
231
-
232
-
233
-
234
-
235
-
236
-
237
-
238
-
239
-
240
-
241
-
242
-
243
-
244
-
245
-
246
-
247
-
248
-
249
-
250
-
251
-
252
-
253
-
254
-
255
-
256
-
257
-
258
-
259
-
260
-
261
-
262
-
263
-
264
-
265
-
266
-
267
-
268
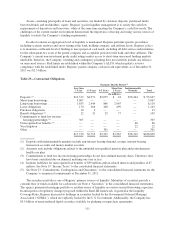
 |
 |
unpaid at the conversion date were settled through issuance of common shares in accordance with the original
document. Approximately 63 million common shares were issued in 2010 in the conversion and dividend
settlement. No Series B shares were outstanding at December 31, 2011 or 2010.
In addition to the offerings mentioned above, in 2009 the Company also issued approximately 33 million
common shares in exchange for $202 million of outstanding 6.625 percent trust preferred securities issued by
Regions Financing Trust II (“the Trust”). The trust preferred securities were exchanged for junior subordinated
notes issued by the Company to the Trust. The Company recognized a pre-tax gain of approximately $61 million
on the extinguishment of the junior subordinated notes. The increase in shareholders’ equity related to the debt
for common share exchange was approximately $135 million, net of issuance costs.
These public offerings along with other capital raising efforts resulted in Regions fully meeting the Tier 1
common equity capital requirement and exceeding the Tier 1 capital requirements prescribed by the SCAP (see
Table 2 “GAAP to Non-GAAP Reconciliation” for further discussion).
At December 31, 2011, Regions had 23 million common shares available for repurchase through open
market transactions under an existing share repurchase authorization. There were no treasury stock purchases
through open market transactions during 2011 or 2010. The Company’s ability to repurchase its common stock is
limited by the terms of the Purchase Agreement between Regions and the U.S. Treasury entered into on
November 14, 2008, pursuant to the U.S. Treasury’s Capital Purchase Program (“CPP”). See Part II, Item 5
(“Market for Registrant’s Common Equity, Related Stockholder Matters and Issuer Purchases of Equity
Securities”) for more information.
Regions’ ratio of stockholders’ equity to total assets was 12.99 percent at December 31, 2011 and 12.64
percent December 31, 2010. Regions’ ratio of tangible common stockholders’ equity (stockholders’ equity less
preferred stock, goodwill and other identifiable intangibles and the related deferred tax liability) to total tangible
assets was 6.58 percent at December 31, 2011 compared to 6.04 percent at December 31, 2010 (see Table 2
“GAAP to Non-GAAP Reconciliation” for further discussion). The increase between years was a result of the
change in accumulated other comprehensive income and the reduction in tangible assets.
In 2011 and 2010, Regions’ annual dividend was $0.04 per common share compared to $0.13 in 2009.
Regions does not expect to increase its quarterly dividend above $0.01 per common share for the foreseeable
future.
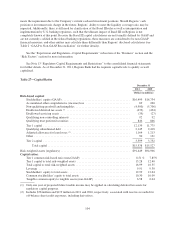
BANK REGULATORY CAPITAL REQUIREMENTS
Regions and Regions Bank are required to comply with regulatory capital requirements established by
Federal and State banking agencies. These regulatory capital requirements involve quantitative measures of the
Company’s assets, liabilities and certain off-balance sheet items, and also qualitative judgments by the
regulators. Failure to meet minimum capital requirements can subject the Company to a series of increasingly
restrictive regulatory actions. Currently, there are two basic measures of capital adequacy: a risk-based measure
and a leverage measure.
The risk-based capital requirements are designed to make regulatory capital requirements more sensitive to
differences in credit and market risk profiles among banks and bank holding companies, to account for
off-balance sheet exposure and interest rate risk, and to minimize disincentives for holding liquid assets. Assets
and off-balance sheet items are assigned to broad risk categories, each with specified risk-weighting factors. The
resulting capital ratios represent capital as a percentage of total risk-weighted assets, inclusive of off-balance
sheet items. Banking organizations that are considered to have excessive interest rate risk exposure are required
to maintain higher levels of capital.
102