Regions Bank 2011 Annual Report Download - page 91
Download and view the complete annual report
Please find page 91 of the 2011 Regions Bank annual report below. You can navigate through the pages in the report by either clicking on the pages listed below, or by using the keyword search tool below to find specific information within the annual report.-
 1
1 -
2
-
3
-
4
-
5
-
6
-
7
-
8
-
9
-
10
-
11
-
12
-
13
-
14
-
15
-
16
-
17
-
18
-
19
-
20
-
21
-
22
-
23
-
24
-
25
-
26
-
27
-
28
-
29
-
30
-
31
-
32
-
33
-
34
-
35
-
36
-
37
-
38
-
39
-
40
-
41
-
42
-
43
-
44
-
45
-
46
-
47
-
48
-
49
-
50
-
51
-
52
-
53
-
54
-
55
-
56
-
57
-
58
-
59
-
60
-
61
-
62
-
63
-
64
-
65
-
66
-
67
-
68
-
69
-
70
-
71
-
72
-
73
-
74
-
75
-
76
-
77
-
78
-
79
-
80
-
 81
81 -
 82
82 -
 83
83 -
 84
84 -
 85
85 -
 86
86 -
 87
87 -
 88
88 -
 89
89 -
 90
90 -
 91
91 -
 92
92 -
 93
93 -
 94
94 -
 95
95 -
 96
96 -
 97
97 -
 98
98 -
 99
99 -
 100
100 -
 101
101 -
102
-
103
-
104
-
105
-
106
-
107
-
108
-
109
-
110
-
111
-
112
-
113
-
114
-
115
-
116
-
117
-
118
-
119
-
120
-
121
-
122
-
123
-
124
-
125
-
126
-
127
-
128
-
129
-
130
-
131
-
132
-
133
-
134
-
135
-
136
-
137
-
138
-
139
-
140
-
141
-
142
-
143
-
144
-
145
-
146
-
147
-
148
-
149
-
150
-
151
-
152
-
153
-
154
-
155
-
156
-
157
-
158
-
159
-
160
-
161
-
162
-
163
-
164
-
165
-
166
-
167
-
168
-
169
-
170
-
171
-
172
-
173
-
174
-
175
-
176
-
177
-
178
-
179
-
180
-
181
-
182
-
183
-
184
-
185
-
186
-
187
-
188
-
189
-
190
-
191
-
192
-
193
-
194
-
195
-
196
-
197
-
198
-
199
-
200
-
201
-
202
-
203
-
204
-
205
-
206
-
207
-
208
-
209
-
210
-
211
-
212
-
213
-
214
-
215
-
216
-
217
-
218
-
219
-
220
-
221
-
222
-
223
-
224
-
225
-
226
-
227
-
228
-
229
-
230
-
231
-
232
-
233
-
234
-
235
-
236
-
237
-
238
-
239
-
240
-
241
-
242
-
243
-
244
-
245
-
246
-
247
-
248
-
249
-
250
-
251
-
252
-
253
-
254
-
255
-
256
-
257
-
258
-
259
-
260
-
261
-
262
-
263
-
264
-
265
-
266
-
267
-
268
 |
 |

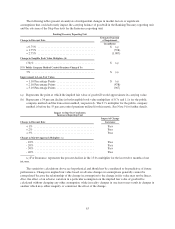
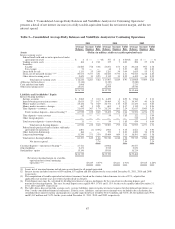
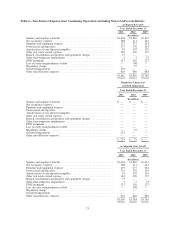
Table 3 “Consolidated Average Daily Balances and Yield/Rate Analysis for Continuing Operations”
presents a detail of net interest income (on a fully taxable-equivalent basis) the net interest margin, and the net
interest spread.
Table 3—Consolidated Average Daily Balances and Yield/Rate Analysis for Continuing Operations
2011 2010 2009
Average
Balance
Income/
Expense
Yield/
Rate
Average
Balance
Income/
Expense
Yield/
Rate
Average
Balance
Income/
Expense
Yield/
Rate
Assets (Dollars in millions; yields on taxable-equivalent basis)
Interest-earning assets:
Federal funds sold and securities purchased under
agreements to resell ......................... $ 4 $ — — %$ 377 $ 2 0.53%$ 124 $ — — %
Trading account assets ......................... 166 4 2.41 175 7 4.00 506 25 4.94
Securities:
Taxable .................................. 24,586 758 3.08 23,851 873 3.66 20,218 966 4.78
Tax-exempt ............................... 31 — — 44 1 2.27 460 29 6.30
Loans held for sale ............................ 1,131 35 3.09 1,281 39 3.04 1,655 55 3.32
Loans, net of unearned income (1) (2) .............. 80,673 3,477 4.31 86,660 3,734 4.31 94,523 4,218 4.46
Other interest-earning assets .................... 5,623 13 0.23 5,119 13 0.25 6,499 16 0.25
Total interest-earning assets .............. 112,214 4,287 3.82 117,507 4,669 3.97 123,985 5,309 4.28
Allowance for loan losses ........................ (3,114) (3,187) (2,240)
Cash and due from banks ........................ 1,988 2,021 2,213
Other non-earning assets ......................... 15,631 16,379 15,510
$126,719 $132,720 $139,468
Liabilities and Stockholders’ Equity
Interest-bearing liabilities:
Savings accounts ............................. $ 5,062 5 0.10 $ 4,459 4 0.09 $ 3,984 5 0.13
Interest-bearing transaction accounts ............. 15,613 27 0.17 14,404 32 0.22 14,347 40 0.28
Money market accounts ........................ 25,142 72 0.29 26,753 116 0.43 21,434 181 0.84
Money market accounts—foreign ................ 467 1 0.21 601 1 0.17 1,139 3 0.26
Time deposits—customer ...................... 21,635 367 1.70 26,236 601 2.29 32,617 1,045 3.20
Total customer deposits—interest-bearing (4) ..... 67,919 472 0.69 72,453 754 1.04 73,521 1,274 1.73
Time deposits—non customer ................... 11 — — 54 1 1.85 122 2 1.64
Other foreign deposits ......................... — — — — — — 312 1 0.32
Total treasury deposits—interest-bearing .......... 11 — — 54 1 1.85 434 3 0.69
Total interest-bearing deposits ............. 67,930 472 0.69 72,507 755 1.04 73,955 1,277 1.73
Federal funds purchased and securities sold under
agreements to repurchase .................... 1,801 (1) (0.06) 1,983 3 0.15 2,661 8 0.30
Other short-term borrowings .................... 186 — — 331 1 0.30 4,600 36 0.78
Long-term borrowings ......................... 11,240 371 3.30 15,489 489 3.16 18,501 663 3.58
Total interest-bearing liabilities .................. 81,157 842 1.04 90,310 1,248 1.38 99,717 1,984 1.99
Net interest spread ...................... 2.78 2.59 2.29
Customer deposits—non-interest-bearing (4) .......... 27,741 23,982 20,657
Other liabilities ................................ 2,471 2,512 2,870
Stockholders’ equity ............................ 15,350 15,916 16,224
$126,719 $132,720 $139,468
Net interest income/margin on a taxable-
equivalent basis from continuing
operations (3)(5) ......................... $3,445 3.07% $3,421 2.91% $3,325 2.68%
(1) Loans, net of unearned income include non-accrual loans for all periods presented.
(2) Interest income includes loan fees of $50 million, $37 million and $30 million for the years ended December 31, 2011, 2010 and 2009,
respectively.
(3) The computation of taxable-equivalent net interest income is based on the stautory federal income tax rate of 35%, adjusted for
applicable state income taxes net of the related federal tax benefit.
(4) Total deposit costs may be calculated by dividing total interest expense on deposits by the sum of interest-bearing deposits and
non-interest bearing deposits. The rates for total deposit costs equal 0.49%, 0.78% and 1.35% for the twelve months ended December 31,
2011, 2010 and 2009, respectively.
(5) The table above does not include average assets, average liabilities, interest income or interest expense for discontinued operations (see
Note 3 to the consolidated financial statements). If these assets, liabilities, and net interest income were included in the calculation, the
consolidated net interest income and margin on a taxable equivalent basis would be $3,476 million and 3.05%, $3,464 million and 2.90%
and $3,367 million and 2.67% for the years ended December 31, 2011, 2010, and 2009, respectively.
67