Regions Bank 2011 Annual Report Download - page 78
Download and view the complete annual report
Please find page 78 of the 2011 Regions Bank annual report below. You can navigate through the pages in the report by either clicking on the pages listed below, or by using the keyword search tool below to find specific information within the annual report.-
 1
1 -
2
-
3
-
4
-
5
-
6
-
7
-
8
-
9
-
10
-
11
-
12
-
13
-
14
-
15
-
16
-
17
-
18
-
19
-
20
-
21
-
22
-
23
-
24
-
25
-
26
-
27
-
28
-
29
-
30
-
31
-
32
-
33
-
34
-
35
-
36
-
37
-
38
-
39
-
40
-
41
-
42
-
43
-
44
-
45
-
46
-
47
-
48
-
49
-
50
-
51
-
52
-
53
-
54
-
55
-
56
-
57
-
58
-
59
-
60
-
61
-
62
-
63
-
64
-
65
-
66
-
67
-
 68
68 -
 69
69 -
 70
70 -
 71
71 -
 72
72 -
 73
73 -
 74
74 -
 75
75 -
 76
76 -
 77
77 -
 78
78 -
 79
79 -
 80
80 -
 81
81 -
 82
82 -
 83
83 -
 84
84 -
 85
85 -
 86
86 -
 87
87 -
 88
88 -
89
-
90
-
91
-
92
-
93
-
94
-
95
-
96
-
97
-
98
-
99
-
100
-
101
-
102
-
103
-
104
-
105
-
106
-
107
-
108
-
109
-
110
-
111
-
112
-
113
-
114
-
115
-
116
-
117
-
118
-
119
-
120
-
121
-
122
-
123
-
124
-
125
-
126
-
127
-
128
-
129
-
130
-
131
-
132
-
133
-
134
-
135
-
136
-
137
-
138
-
139
-
140
-
141
-
142
-
143
-
144
-
145
-
146
-
147
-
148
-
149
-
150
-
151
-
152
-
153
-
154
-
155
-
156
-
157
-
158
-
159
-
160
-
161
-
162
-
163
-
164
-
165
-
166
-
167
-
168
-
169
-
170
-
171
-
172
-
173
-
174
-
175
-
176
-
177
-
178
-
179
-
180
-
181
-
182
-
183
-
184
-
185
-
186
-
187
-
188
-
189
-
190
-
191
-
192
-
193
-
194
-
195
-
196
-
197
-
198
-
199
-
200
-
201
-
202
-
203
-
204
-
205
-
206
-
207
-
208
-
209
-
210
-
211
-
212
-
213
-
214
-
215
-
216
-
217
-
218
-
219
-
220
-
221
-
222
-
223
-
224
-
225
-
226
-
227
-
228
-
229
-
230
-
231
-
232
-
233
-
234
-
235
-
236
-
237
-
238
-
239
-
240
-
241
-
242
-
243
-
244
-
245
-
246
-
247
-
248
-
249
-
250
-
251
-
252
-
253
-
254
-
255
-
256
-
257
-
258
-
259
-
260
-
261
-
262
-
263
-
264
-
265
-
266
-
267
-
268
 |
 |
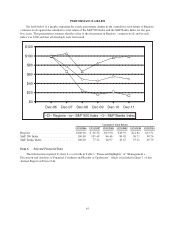
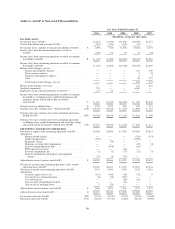
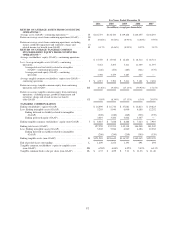
fully-taxable equivalent basis (GAAP) and non-interest income (GAAP) are added together to arrive at total
revenue (GAAP). Adjustments are made to arrive at adjusted total revenue (non-GAAP), which is the
denominator for the fee and efficiency ratios. Regions believes that the non-GAAP measures reflecting these
adjustments provide a meaningful base for period-to-period comparisons, which management believes will assist
investors in analyzing the operating results of the Company and predicting future performance. These non-GAAP
financial measures are also used by management to assess the performance of Regions’ business. It is possible
that the activities related to the adjustments may recur; however, management does not consider the activities
related to the adjustments to be indications of ongoing operations. Regions believes that presentation of these
non-GAAP financial measures will permit investors to assess the performance of the Company on the same basis
as that applied by management.
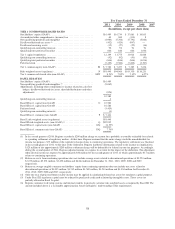
Tangible common stockholders’ equity ratios have become a focus of some investors in analyzing the
capital position of the Company absent the effects of intangible assets and preferred stock. Traditionally, the
Federal Reserve and other banking regulatory bodies have assessed a bank’s capital adequacy based on Tier 1
capital, the calculation of which is codified in federal banking regulations. In connection with the Federal
Reserve’s CCAR process, these regulators are supplementing their assessment of the capital adequacy of a bank
based on a variation of Tier 1 capital, known as Tier 1 common equity. While not codified, analysts and banking
regulators have assessed Regions’ capital adequacy using the tangible common stockholders’ equity and/or the
Tier 1 common equity measure. Because tangible common stockholders’ equity and Tier 1 common equity are
not formally defined by GAAP or codified in the federal banking regulations, these measures are considered to
be non-GAAP financial measures and other entities may calculate them differently than Regions’ disclosed
calculations. Since analysts and banking regulators may assess Regions’ capital adequacy using tangible common
stockholders’ equity and Tier 1 common equity, Regions believes that it is useful to provide investors
information enabling them to assess Regions’ capital adequacy on these same bases.
Tier 1 common equity is often expressed as a percentage of risk-weighted assets. Under the risk-based
capital framework, a bank’s balance sheet assets and credit equivalent amounts of off-balance sheet items are
assigned to one of four broad risk categories. The aggregated dollar amount in each category is then multiplied
by the risk weighting assigned to that category. The resulting weighted values from each of the four categories
are added together and this sum is the risk-weighted assets total that, as adjusted, comprises the denominator of
certain risk-based capital ratios. Tier 1 capital is then divided by this denominator (risk-weighted assets) to
determine the Tier 1 capital ratio. Adjustments are made to Tier 1 capital to arrive at Tier 1 common equity (non-
GAAP). Tier 1 common equity is also divided by the risk-weighted assets to determine the Tier 1 common equity
ratio. The amounts disclosed as risk-weighted assets are calculated consistent with banking regulatory
requirements.
Regions currently calculates its risk-based capital ratios under guidelines adopted by the Federal Reserve
based on the 1988 Capital Accord (“Basel I”) of the Basel Committee on Banking Supervision (the “Basel
Committee”). In December 2010, the Basel Committee released its final framework for Basel III, which will
strengthen international capital and liquidity regulation. When implemented by U.S. bank regulatory agencies
and fully phased-in, Basel III will change capital requirements and place greater emphasis on common equity.
Implementation of Basel III will begin on January 1, 2013, and will be phased in over a multi-year period. The
U.S. bank regulatory agencies have not yet adopted final regulations governing the implementation of Basel III.
Accordingly, the calculations provided below are estimates, based on Regions’ current understanding of the
framework, including the Company’s reading of the requirements, and informal feedback received through the
regulatory process. Regions’ understanding of the framework is evolving and will likely change as the
regulations are finalized. Because the Basel III implementation regulations are not formally defined by GAAP
and have not yet been finalized and codified, these measures are considered to be non-GAAP financial measures,
and other entities may calculate them differently from Regions’ disclosed calculations. Since analysts and
banking regulators may assess Regions’ capital adequacy using the Basel III framework, Regions believes that it
is useful to provide investors information enabling them to assess Regions’ capital adequacy on the same basis.
54