Regions Bank 2011 Annual Report Download - page 214
Download and view the complete annual report
Please find page 214 of the 2011 Regions Bank annual report below. You can navigate through the pages in the report by either clicking on the pages listed below, or by using the keyword search tool below to find specific information within the annual report.-
 1
1 -
2
-
3
-
4
-
5
-
6
-
7
-
8
-
9
-
10
-
11
-
12
-
13
-
14
-
15
-
16
-
17
-
18
-
19
-
20
-
21
-
22
-
23
-
24
-
25
-
26
-
27
-
28
-
29
-
30
-
31
-
32
-
33
-
34
-
35
-
36
-
37
-
38
-
39
-
40
-
41
-
42
-
43
-
44
-
45
-
46
-
47
-
48
-
49
-
50
-
51
-
52
-
53
-
54
-
55
-
56
-
57
-
58
-
59
-
60
-
61
-
62
-
63
-
64
-
65
-
66
-
67
-
68
-
69
-
70
-
71
-
72
-
73
-
74
-
75
-
76
-
77
-
78
-
79
-
80
-
81
-
82
-
83
-
84
-
85
-
86
-
87
-
88
-
89
-
90
-
91
-
92
-
93
-
94
-
95
-
96
-
97
-
98
-
99
-
100
-
101
-
102
-
103
-
104
-
105
-
106
-
107
-
108
-
109
-
110
-
111
-
112
-
113
-
114
-
115
-
116
-
117
-
118
-
119
-
120
-
121
-
122
-
123
-
124
-
125
-
126
-
127
-
128
-
129
-
130
-
131
-
132
-
133
-
134
-
135
-
136
-
137
-
138
-
139
-
140
-
141
-
142
-
143
-
144
-
145
-
146
-
147
-
148
-
149
-
150
-
151
-
152
-
153
-
154
-
155
-
156
-
157
-
158
-
159
-
160
-
161
-
162
-
163
-
164
-
165
-
166
-
167
-
168
-
169
-
170
-
171
-
172
-
173
-
174
-
175
-
176
-
177
-
178
-
179
-
180
-
181
-
182
-
183
-
184
-
185
-
186
-
187
-
188
-
189
-
190
-
191
-
192
-
193
-
194
-
195
-
196
-
197
-
198
-
199
-
200
-
201
-
202
-
203
-
 204
204 -
 205
205 -
 206
206 -
 207
207 -
 208
208 -
 209
209 -
 210
210 -
 211
211 -
 212
212 -
 213
213 -
 214
214 -
 215
215 -
 216
216 -
 217
217 -
 218
218 -
 219
219 -
 220
220 -
 221
221 -
 222
222 -
 223
223 -
 224
224 -
225
-
226
-
227
-
228
-
229
-
230
-
231
-
232
-
233
-
234
-
235
-
236
-
237
-
238
-
239
-
240
-
241
-
242
-
243
-
244
-
245
-
246
-
247
-
248
-
249
-
250
-
251
-
252
-
253
-
254
-
255
-
256
-
257
-
258
-
259
-
260
-
261
-
262
-
263
-
264
-
265
-
266
-
267
-
268
 |
 |

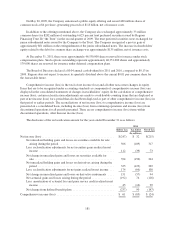
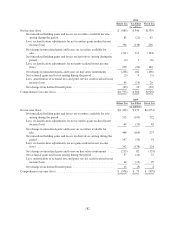
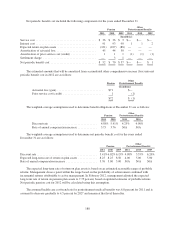
The following table presents the fair value of Regions’ defined-benefit pension plans’ and other
postretirement plans’ financial assets as of December 31:
2011 2010
Level 1 Level 2 Level 3 Fair Value Level 1 Level 2 Level 3 Fair Value
(In millions)
Cash and cash equivalents(1) ....... $ 30 $— $— $ 30 $100 $— $— $ 100
Fixed income securities:
U.S. Treasury and federal
agency securities .......... — 116 — 116 — 104 — 104
Mortgage-backed securities . . . — 11 — 11 — 14 — 14
Collateralized mortgage
obligations ............... — 11 — 11 — 22 — 22
Obligations of states and
political subdivisions ...... — 1 — 1 — 1 — 1
Corporate bonds ............ — 158 — 158 — 130 — 130
Total fixed income
securities ............ $— $297 $— $ 297 $— $271 $— $ 271
Equity securities:
Domestic .................. 211 — — 211 235 — — 235
International ............... 3 — — 3 3 — — 3
Total common stock ..... $214 $— $— $ 214 $238 $— $— $ 238
Mutual funds:
Domestic .................. 309 — — 309 235 — — 235
International ............... 1 — — 1 133 — — 133
Total mutual funds ...... $310 $— $— $ 310 $368 $— $— $ 368
Collective investment trust funds:
Fixed income fund .......... — 210 — 210 — 172 — 172
Common stock fund ......... — 31 — 31 — 40 — 40
International fund ........... — 120 — 120 — 158 — 158
$— 361 — $ 361 $— 370 — $ 370
International hedge funds ......... $— $ 73 $— $ 73 $— $ 54 $— $ 54
Real estate funds ................ $— $— $186 $ 186 $— $— $102 $ 102
Private equity funds ............. $— $— $ 26 $ 26 $— $— $ 9 $ 9
Other assets .................... $— $— $ 1 $ 1 $— $— $ 1 $ 1
$554 $731 $213 $1,498 $706 $695 $112 $1,513
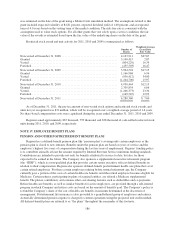
(1) This amount includes financial assets related to other postretirement plans of approximately $4 million at
both December 31, 2011 and 2010.
For all investments, quoted market prices of identical assets on active exchanges, or Level 1 measurements,
are used if available. Where such quoted market prices are not available, quoted market prices of similar
instruments (including matrix pricing) and/or discounted cash flows to estimate a value of these securities, or
Level 2 measurements are utilized. Level 2 discounted cash flow analyses are typically based on market interest
rates, prepayment speeds and/or option adjusted spreads. Level 3 measurements are based on assumptions that
are not readily observable in the market place.
190