Regions Bank 2011 Annual Report Download - page 77
Download and view the complete annual report
Please find page 77 of the 2011 Regions Bank annual report below. You can navigate through the pages in the report by either clicking on the pages listed below, or by using the keyword search tool below to find specific information within the annual report.-
 1
1 -
2
-
3
-
4
-
5
-
6
-
7
-
8
-
9
-
10
-
11
-
12
-
13
-
14
-
15
-
16
-
17
-
18
-
19
-
20
-
21
-
22
-
23
-
24
-
25
-
26
-
27
-
28
-
29
-
30
-
31
-
32
-
33
-
34
-
35
-
36
-
37
-
38
-
39
-
40
-
41
-
42
-
43
-
44
-
45
-
46
-
47
-
48
-
49
-
50
-
51
-
52
-
53
-
54
-
55
-
56
-
57
-
58
-
59
-
60
-
61
-
62
-
63
-
64
-
65
-
66
-
 67
67 -
 68
68 -
 69
69 -
 70
70 -
 71
71 -
 72
72 -
 73
73 -
 74
74 -
 75
75 -
 76
76 -
 77
77 -
 78
78 -
 79
79 -
 80
80 -
 81
81 -
 82
82 -
 83
83 -
 84
84 -
 85
85 -
 86
86 -
 87
87 -
88
-
89
-
90
-
91
-
92
-
93
-
94
-
95
-
96
-
97
-
98
-
99
-
100
-
101
-
102
-
103
-
104
-
105
-
106
-
107
-
108
-
109
-
110
-
111
-
112
-
113
-
114
-
115
-
116
-
117
-
118
-
119
-
120
-
121
-
122
-
123
-
124
-
125
-
126
-
127
-
128
-
129
-
130
-
131
-
132
-
133
-
134
-
135
-
136
-
137
-
138
-
139
-
140
-
141
-
142
-
143
-
144
-
145
-
146
-
147
-
148
-
149
-
150
-
151
-
152
-
153
-
154
-
155
-
156
-
157
-
158
-
159
-
160
-
161
-
162
-
163
-
164
-
165
-
166
-
167
-
168
-
169
-
170
-
171
-
172
-
173
-
174
-
175
-
176
-
177
-
178
-
179
-
180
-
181
-
182
-
183
-
184
-
185
-
186
-
187
-
188
-
189
-
190
-
191
-
192
-
193
-
194
-
195
-
196
-
197
-
198
-
199
-
200
-
201
-
202
-
203
-
204
-
205
-
206
-
207
-
208
-
209
-
210
-
211
-
212
-
213
-
214
-
215
-
216
-
217
-
218
-
219
-
220
-
221
-
222
-
223
-
224
-
225
-
226
-
227
-
228
-
229
-
230
-
231
-
232
-
233
-
234
-
235
-
236
-
237
-
238
-
239
-
240
-
241
-
242
-
243
-
244
-
245
-
246
-
247
-
248
-
249
-
250
-
251
-
252
-
253
-
254
-
255
-
256
-
257
-
258
-
259
-
260
-
261
-
262
-
263
-
264
-
265
-
266
-
267
-
268
 |
 |
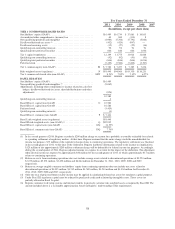
Non-interest expense from continuing operations totaled $3.9 billion in both 2011 and 2010. Non-interest
expenses included a $253 million goodwill impairment charge in 2011 and a $75 million regulatory charge in
2010. The 2011 period included lower salaries and employee benefits due to reduced headcount and lower
pension expense, lower occupancy expense and lower credit-related costs. The 2010 period was impacted by a
loss on early extinguishment of debt related to prepayment of Federal Home Loan Bank advances. See Table 6,
“Non-Interest Expense from Continuing Operations (including Non-GAAP reconciliation)” for further details.
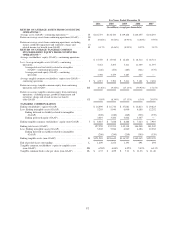
Total loans decreased by $5.3 billion, or 6.4 percent in 2011, driven primarily by a strategic decision to
lower exposure to investor real estate. Decreases in residential first mortgage and home equity loans also
contributed to the year-over-year decrease primarily resulting from consumers’ decisions to de-leverage. These
decreases were partially offset by growth in the commercial and industrial category, the purchase of a $1.1
billion credit card portfolio, and increases in indirect loans. Total deposits increased $1.0 billion in 2011 to $95.6
billion at December 31, 2011, and low-cost customer deposits increased $4.4 billion, or 6.2 percent, in 2011.
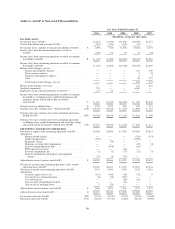
Regions’ Tier 1 capital (regulatory) and Tier 1 common (non-GAAP) ratios were 13.28 percent and 8.51
percent at December 31, 2011. The corresponding Basel III ratios (non-GAAP), based on Regions’ current
understanding of the guidelines, were approximately 11.39 percent and 7.70 percent, which exceed the respective
Basel III minimums of 8.5 percent and 7 percent (see Table 2, “GAAP to Non-GAAP Reconciliation” for a
reconciliation of the non-GAAP measures to the corresponding GAAP or regulatory measure).
Table 2 “GAAP to Non-GAAP Reconciliation” presents computations of earnings (loss) and certain other
financial measures excluding merger, goodwill impairment and regulatory charge and related income tax benefit;
these measures include “fee income ratio”, “efficiency ratio”, “return on average assets from continuing
operations”, “return on average tangible common stockholders’ equity from continuing operations”, end of
period “tangible common stockholders’ equity” and related ratios, “Tier 1 common equity” and related ratios,
and “Basel III ratios”, all of which are non-GAAP measures. Merger, goodwill impairment, and the regulatory
charge and related income tax benefit are included in accordance with generally accepted accounting principles
(“GAAP”). Regions believes the exclusion of merger, goodwill impairment and regulatory charge and related
income tax benefit in expressing earnings and certain other financial measures provides a meaningful base for
period-to-period comparisons, which management believes will assist investors in analyzing the operating results
of the Company and predicting future performance. These non-GAAP financial measures are also used by
management to assess the performance of Regions’ business because management does not consider these
charges to be as relevant to ongoing operating results. Management and the Board of Directors utilize these
non-GAAP financial measures as follows:
• Preparation of Regions’ operating budgets
• Monthly financial performance reporting
• Monthly close-out reporting of consolidated results (management only)
• Presentations to investors of Company performance
Regions believes that presenting these non-GAAP financial measures will permit investors to assess the
performance of the Company on the same basis as that applied by management and the Board of Directors. The
third quarter of 2008 was the final quarter for merger charges related to the AmSouth acquisition.
The efficiency ratio (non-GAAP), which is a measure of productivity, is generally calculated as non-interest
expense divided by total revenue on a fully-taxable equivalent basis. The fee ratio (non-GAAP) is generally
calculated as non-interest income divided by total revenue. Management uses these ratios to monitor
performance and believes these measures provide meaningful information to investors. Non-interest expense
(GAAP) is presented excluding adjustments to arrive at adjusted non-interest expense (non-GAAP), which is the
numerator for the efficiency ratio. Non-interest income (GAAP) is presented excluding adjustments to arrive at
adjusted non-interest income (non-GAAP), which is the numerator for the fee ratio. Net interest income on a
53