Regions Bank 2011 Annual Report Download - page 107
Download and view the complete annual report
Please find page 107 of the 2011 Regions Bank annual report below. You can navigate through the pages in the report by either clicking on the pages listed below, or by using the keyword search tool below to find specific information within the annual report.-
 1
1 -
2
-
3
-
4
-
5
-
6
-
7
-
8
-
9
-
10
-
11
-
12
-
13
-
14
-
15
-
16
-
17
-
18
-
19
-
20
-
21
-
22
-
23
-
24
-
25
-
26
-
27
-
28
-
29
-
30
-
31
-
32
-
33
-
34
-
35
-
36
-
37
-
38
-
39
-
40
-
41
-
42
-
43
-
44
-
45
-
46
-
47
-
48
-
49
-
50
-
51
-
52
-
53
-
54
-
55
-
56
-
57
-
58
-
59
-
60
-
61
-
62
-
63
-
64
-
65
-
66
-
67
-
68
-
69
-
70
-
71
-
72
-
73
-
74
-
75
-
76
-
77
-
78
-
79
-
80
-
81
-
82
-
83
-
84
-
85
-
86
-
87
-
88
-
89
-
90
-
91
-
92
-
93
-
94
-
95
-
96
-
 97
97 -
 98
98 -
 99
99 -
 100
100 -
 101
101 -
 102
102 -
 103
103 -
 104
104 -
 105
105 -
 106
106 -
 107
107 -
 108
108 -
 109
109 -
 110
110 -
 111
111 -
 112
112 -
 113
113 -
 114
114 -
 115
115 -
 116
116 -
 117
117 -
118
-
119
-
120
-
121
-
122
-
123
-
124
-
125
-
126
-
127
-
128
-
129
-
130
-
131
-
132
-
133
-
134
-
135
-
136
-
137
-
138
-
139
-
140
-
141
-
142
-
143
-
144
-
145
-
146
-
147
-
148
-
149
-
150
-
151
-
152
-
153
-
154
-
155
-
156
-
157
-
158
-
159
-
160
-
161
-
162
-
163
-
164
-
165
-
166
-
167
-
168
-
169
-
170
-
171
-
172
-
173
-
174
-
175
-
176
-
177
-
178
-
179
-
180
-
181
-
182
-
183
-
184
-
185
-
186
-
187
-
188
-
189
-
190
-
191
-
192
-
193
-
194
-
195
-
196
-
197
-
198
-
199
-
200
-
201
-
202
-
203
-
204
-
205
-
206
-
207
-
208
-
209
-
210
-
211
-
212
-
213
-
214
-
215
-
216
-
217
-
218
-
219
-
220
-
221
-
222
-
223
-
224
-
225
-
226
-
227
-
228
-
229
-
230
-
231
-
232
-
233
-
234
-
235
-
236
-
237
-
238
-
239
-
240
-
241
-
242
-
243
-
244
-
245
-
246
-
247
-
248
-
249
-
250
-
251
-
252
-
253
-
254
-
255
-
256
-
257
-
258
-
259
-
260
-
261
-
262
-
263
-
264
-
265
-
266
-
267
-
268
 |
 |

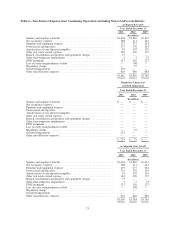
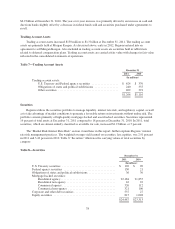
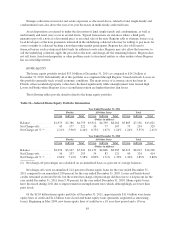
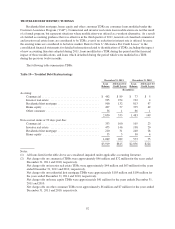
2011, primarily due to lower mortgage origination volume reflecting decreased refinance activity in 2011 as
compared to 2010. Mortgage originations totaled $6.3 billion in 2011 as compared to $8.2 billion in 2010. Refer
to Note 6 “Allowance for Credit Losses” to the consolidated financial statements for additional discussion.
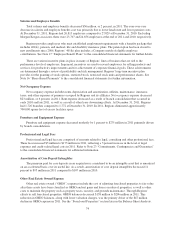
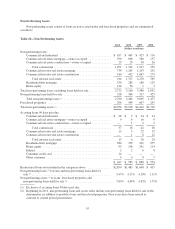
Home Equity—Home equity lending includes both home equity loans and lines of credit. This type of
lending, which is secured by a first or second mortgage on the borrower’s residence, allows customers to borrow
against the equity in their home. Substantially all of this portfolio was originated through Regions’ branch
network. During 2011, home equity balances decreased $1.2 billion to $13.0 billion, driven by the continued
general decline in demand and lower property valuations across the Company’s operating footprint. During 2011,
credit quality within the home equity portfolio continued to reflect pressure, but total charge-offs during 2011
decreased as compared to 2010. However, losses in Florida based-credits where the collateral is a second lien
remained at elevated levels, as unemployment levels remain high and property valuations in certain markets have
continued to experience ongoing deterioration. More information related to these developments is included in the
“Home Equity” discussion below.
Indirect—Indirect lending, which is lending initiated through third-party business partners, is largely
comprised of loans made through automotive dealerships. This portfolio class increased $256 million, or 16
percent in 2011, reflecting growth from the late 2010 re-entry into the indirect auto lending business.
Consumer Credit Card—During the second quarter of 2011, Regions completed the purchase of
approximately $1.0 billion of Regions-branded consumer credit card accounts from FIA Card Services. The
products are primarily open-ended variable interest rate consumer credit card loans.
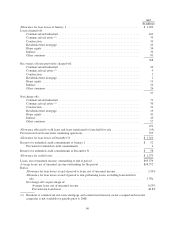
Other Consumer—Other consumer loans include direct consumer installment loans, overdrafts and other
revolving credit, and educational loans. Other consumer loans totaled $1.2 billion at December 31, 2011,
relatively unchanged from the prior year.
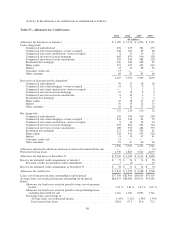
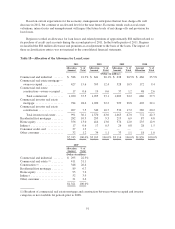
CREDIT QUALITY
Weak economic conditions, including declining property values and high levels of unemployment, impacted
the credit quality of Regions’ loan portfolio. Investor real estate loans and home equity products (particularly
Florida second lien—see Table 14) carry a higher risk of non-collection than many other loans.
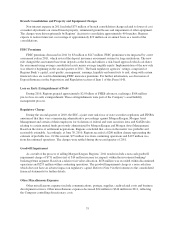
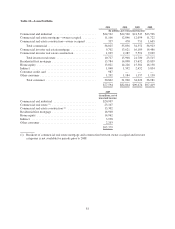
The following chart presents details of Regions’ $10.7 billion investor real estate portfolio as of
December 31, 2011 (dollars in billions):
Land
$0.9 B / 8%
Single Family
$0.8 B / 8%
Industrial
$0.8 B / 8% Other
$0.6 B / 6%
Hotel
$0.7 B / 6%
Condo
$0.2 B / 1%
Multi-Family
$2.6 B / 24%
Retail
$2.2 B / 21%
Office
$1.9 B / 18%
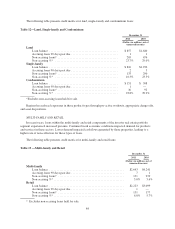
LAND, SINGLE-FAMILY AND CONDOMINIUM
Credit quality of the investor real estate portfolio segment is sensitive to risks associated with construction
loans such as cost overruns, project completion risk, general contractor credit risk, environmental and other
hazard risks, and market risks associated with the sale or rental of completed properties. Certain components of
the investor real estate portfolio segment carry a higher risk of non-collection. While losses within these loan
types were influenced by conditions described above, the most significant drivers of losses were the continued
decline in demand for residential real estate and in the value of property. The land, single-family and
condominium components of the investor real estate portfolio segment are particularly affected by these risks and
conditions.
83