Regions Bank 2011 Annual Report Download - page 216
Download and view the complete annual report
Please find page 216 of the 2011 Regions Bank annual report below. You can navigate through the pages in the report by either clicking on the pages listed below, or by using the keyword search tool below to find specific information within the annual report.-
 1
1 -
2
-
3
-
4
-
5
-
6
-
7
-
8
-
9
-
10
-
11
-
12
-
13
-
14
-
15
-
16
-
17
-
18
-
19
-
20
-
21
-
22
-
23
-
24
-
25
-
26
-
27
-
28
-
29
-
30
-
31
-
32
-
33
-
34
-
35
-
36
-
37
-
38
-
39
-
40
-
41
-
42
-
43
-
44
-
45
-
46
-
47
-
48
-
49
-
50
-
51
-
52
-
53
-
54
-
55
-
56
-
57
-
58
-
59
-
60
-
61
-
62
-
63
-
64
-
65
-
66
-
67
-
68
-
69
-
70
-
71
-
72
-
73
-
74
-
75
-
76
-
77
-
78
-
79
-
80
-
81
-
82
-
83
-
84
-
85
-
86
-
87
-
88
-
89
-
90
-
91
-
92
-
93
-
94
-
95
-
96
-
97
-
98
-
99
-
100
-
101
-
102
-
103
-
104
-
105
-
106
-
107
-
108
-
109
-
110
-
111
-
112
-
113
-
114
-
115
-
116
-
117
-
118
-
119
-
120
-
121
-
122
-
123
-
124
-
125
-
126
-
127
-
128
-
129
-
130
-
131
-
132
-
133
-
134
-
135
-
136
-
137
-
138
-
139
-
140
-
141
-
142
-
143
-
144
-
145
-
146
-
147
-
148
-
149
-
150
-
151
-
152
-
153
-
154
-
155
-
156
-
157
-
158
-
159
-
160
-
161
-
162
-
163
-
164
-
165
-
166
-
167
-
168
-
169
-
170
-
171
-
172
-
173
-
174
-
175
-
176
-
177
-
178
-
179
-
180
-
181
-
182
-
183
-
184
-
185
-
186
-
187
-
188
-
189
-
190
-
191
-
192
-
193
-
194
-
195
-
196
-
197
-
198
-
199
-
200
-
201
-
202
-
203
-
204
-
205
-
 206
206 -
 207
207 -
 208
208 -
 209
209 -
 210
210 -
 211
211 -
 212
212 -
 213
213 -
 214
214 -
 215
215 -
 216
216 -
 217
217 -
 218
218 -
 219
219 -
 220
220 -
 221
221 -
 222
222 -
 223
223 -
 224
224 -
 225
225 -
 226
226 -
227
-
228
-
229
-
230
-
231
-
232
-
233
-
234
-
235
-
236
-
237
-
238
-
239
-
240
-
241
-
242
-
243
-
244
-
245
-
246
-
247
-
248
-
249
-
250
-
251
-
252
-
253
-
254
-
255
-
256
-
257
-
258
-
259
-
260
-
261
-
262
-
263
-
264
-
265
-
266
-
267
-
268
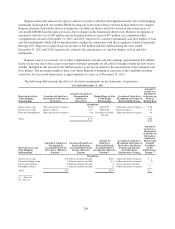
 |
 |

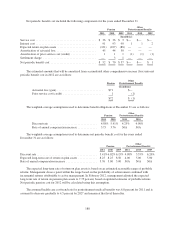
Fair Value Measurements Using
Significant Unobservable Inputs
Year Ended December 31, 2010
(Level 3 measurements only)
Real estate
funds
Private equity
funds Other assets
(In millions)
Beginning balance, January 1, 2010 ............................... $ 56 $ 1 $ 1
Actual return on plan assets:
Net appreciation (depreciation) in fair value of investments .... (4) — —
Purchases, sales, issuances, and settlements, net ................. 50 8 —
Ending balance, December 31, 2010 .............................. $102 $ 9 $ 1
The amount of total gains (losses) for the period attributable to the change
in unrealized gains (losses) relating to assets still held at
December 31, 2010: ......................................... $ (4) $— $—
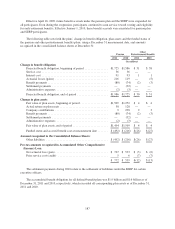
Information about the expected cash flows for the pension plan and other postretirement benefits plans is as
follows:
Pension
Other
Postretirement
Benefits
(In millions)
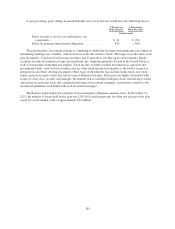
Expected Employer Contributions:
2012 ......................................................... $ 9 $ 2
Expected Benefit Payments:
2012 ......................................................... $ 85 $ 3
2013 ......................................................... 90 3
2014 ......................................................... 96 3
2015 ......................................................... 94 2
2016 ......................................................... 100 2
2017-2021 ..................................................... 576 10
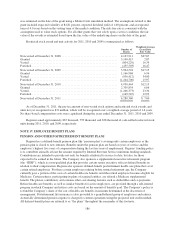
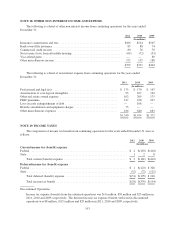
OTHER PLANS
Regions has a defined-contribution 401(k) plan that historically included a company match of eligible
employee contributions. Through March 31, 2009, this match totaled 100 percent of the eligible employee
pre-tax contribution (up to 6 percent of compensation) after one year of service and was initially invested in
Regions common stock. Matching contributions in the 401(k) plan were temporarily suspended beginning in the
second quarter of 2009. Effective January 1, 2010, Regions restored matching contributions to the 401(k) plan to
the pre-existing levels. Regions’ contribution to the 401(k) plan on behalf of employees totaled $42 million, $40
million and $18 million in 2011, 2010 and 2009, respectively. Regions’ 401(k) plan held 34 million and
28 million shares of Regions common stock at December 31, 2011 and 2010, respectively. For the years ended
December 31, 2011, 2010 and 2009, the 401(k) plan received $1 million, $1 million and $5 million, respectively,
in dividends on Regions common stock.
192