Regions Bank 2011 Annual Report Download - page 160
Download and view the complete annual report
Please find page 160 of the 2011 Regions Bank annual report below. You can navigate through the pages in the report by either clicking on the pages listed below, or by using the keyword search tool below to find specific information within the annual report.-
 1
1 -
2
-
3
-
4
-
5
-
6
-
7
-
8
-
9
-
10
-
11
-
12
-
13
-
14
-
15
-
16
-
17
-
18
-
19
-
20
-
21
-
22
-
23
-
24
-
25
-
26
-
27
-
28
-
29
-
30
-
31
-
32
-
33
-
34
-
35
-
36
-
37
-
38
-
39
-
40
-
41
-
42
-
43
-
44
-
45
-
46
-
47
-
48
-
49
-
50
-
51
-
52
-
53
-
54
-
55
-
56
-
57
-
58
-
59
-
60
-
61
-
62
-
63
-
64
-
65
-
66
-
67
-
68
-
69
-
70
-
71
-
72
-
73
-
74
-
75
-
76
-
77
-
78
-
79
-
80
-
81
-
82
-
83
-
84
-
85
-
86
-
87
-
88
-
89
-
90
-
91
-
92
-
93
-
94
-
95
-
96
-
97
-
98
-
99
-
100
-
101
-
102
-
103
-
104
-
105
-
106
-
107
-
108
-
109
-
110
-
111
-
112
-
113
-
114
-
115
-
116
-
117
-
118
-
119
-
120
-
121
-
122
-
123
-
124
-
125
-
126
-
127
-
128
-
129
-
130
-
131
-
132
-
133
-
134
-
135
-
136
-
137
-
138
-
139
-
140
-
141
-
142
-
143
-
144
-
145
-
146
-
147
-
148
-
149
-
 150
150 -
 151
151 -
 152
152 -
 153
153 -
 154
154 -
 155
155 -
 156
156 -
 157
157 -
 158
158 -
 159
159 -
 160
160 -
 161
161 -
 162
162 -
 163
163 -
 164
164 -
 165
165 -
 166
166 -
 167
167 -
 168
168 -
 169
169 -
 170
170 -
171
-
172
-
173
-
174
-
175
-
176
-
177
-
178
-
179
-
180
-
181
-
182
-
183
-
184
-
185
-
186
-
187
-
188
-
189
-
190
-
191
-
192
-
193
-
194
-
195
-
196
-
197
-
198
-
199
-
200
-
201
-
202
-
203
-
204
-
205
-
206
-
207
-
208
-
209
-
210
-
211
-
212
-
213
-
214
-
215
-
216
-
217
-
218
-
219
-
220
-
221
-
222
-
223
-
224
-
225
-
226
-
227
-
228
-
229
-
230
-
231
-
232
-
233
-
234
-
235
-
236
-
237
-
238
-
239
-
240
-
241
-
242
-
243
-
244
-
245
-
246
-
247
-
248
-
249
-
250
-
251
-
252
-
253
-
254
-
255
-
256
-
257
-
258
-
259
-
260
-
261
-
262
-
263
-
264
-
265
-
266
-
267
-
268
 |
 |
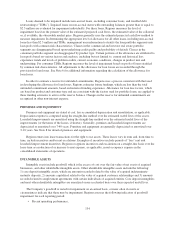
Refer to Note 9 for further discussion of the results of the goodwill and other identifiable intangibles
impairment tests.
ACCOUNTING FOR TRANSFERS AND SERVICING OF FINANCIAL ASSETS
Regions accounts for transfers of financial assets as sales when control over the transferred assets is
surrendered. Control is generally considered to have been surrendered when 1) the transferred assets are legally
isolated from the Company or its consolidated affiliates, even in bankruptcy or other receivership, 2) the
transferee has the right to pledge or exchange the assets with no conditions that constrain the transferee and
provide more than a trivial benefit to the Company, and 3) the Company does not maintain the obligation or
unilateral ability to reclaim or repurchase the assets. If these sale criteria are met, the transferred assets are
removed from the Company’s balance sheet and a gain or loss on sale is recognized. If not met, the transfer is
recorded as a secured borrowing, and the assets remain on the Company’s balance sheet, the proceeds from the
transaction are recognized as a liability, and gain or loss on sale is deferred until the sale criterion are achieved.
Regions has elected to account for its servicing assets using the fair value measurement method. Under the
fair value measurement method, servicing assets are measured at fair value each period with changes in fair value
recorded as a component of mortgage income. Additionally, during the third quarter of 2009, Regions adopted an
option-adjusted spread (“OAS”) valuation approach. The OAS represents the average spread over the LIBOR
swap curve that equates the asset’s discounted cash flows to its market price.
The fair value of mortgage servicing rights is calculated using various assumptions including future cash
flows, market discount rates, expected prepayment rates, servicing costs and other factors. A significant change
in prepayments of mortgages in the servicing portfolio could result in significant changes in the valuation
adjustments, thus creating potential volatility in the carrying amount of mortgage servicing rights. See the “Fair
Value Measurements” section below for additional discussion regarding determination of fair value.
Refer to Note 7 for further information on servicing of financial assets.
FORECLOSED PROPERTY AND OTHER REAL ESTATE
Other real estate and certain other assets acquired in satisfaction of indebtedness (“foreclosure”) are carried
in other assets at the lower of the recorded investment in the loan or fair value less estimated costs to sell the
property. At the date of transfer, when the recorded investment in the loan exceeds the property’s estimated fair
value less costs to sell, write-downs are recorded as estimated charge-offs against the allowance. Regions allows
a period of up to 60 days after the date of transfer to record finalized write-downs as charge-offs against the
allowance in order to properly accumulate all related invoices and updated valuation information, if necessary.
Subsequent to transfer, Regions obtains valuations from professional valuation experts and/or third party
appraisers on at least an annual basis. See the “Fair Value Measurements” section below for additional discussion
regarding determination of fair value. Subsequent to transfer and the additional 60 days, any further write-downs
are recorded as other non-interest expense. Gain or loss on the sale of foreclosed property and other real estate is
included in other non-interest expense.
From time to time, assets classified as premises and equipment are transferred to held for sale for various
reasons. These assets are carried in other assets at the lower of the recorded investment in the asset or fair value
less estimated cost to sell based upon the property’s appraised value at the date of transfer. Any write-downs of
property held for sale are recorded as other non-interest expense. At December 31, 2011 and 2010, the carrying
values of premises and equipment held for sale were approximately $33 million and $28 million, respectively.
DERIVATIVE FINANCIAL INSTRUMENTS AND HEDGING ACTIVITIES
The Company enters into derivative financial instruments to manage interest rate risk, facilitate asset/
liability management strategies and manage other exposures. These instruments primarily include interest rate
136