Regions Bank 2011 Annual Report Download - page 81
Download and view the complete annual report
Please find page 81 of the 2011 Regions Bank annual report below. You can navigate through the pages in the report by either clicking on the pages listed below, or by using the keyword search tool below to find specific information within the annual report.-
 1
1 -
2
-
3
-
4
-
5
-
6
-
7
-
8
-
9
-
10
-
11
-
12
-
13
-
14
-
15
-
16
-
17
-
18
-
19
-
20
-
21
-
22
-
23
-
24
-
25
-
26
-
27
-
28
-
29
-
30
-
31
-
32
-
33
-
34
-
35
-
36
-
37
-
38
-
39
-
40
-
41
-
42
-
43
-
44
-
45
-
46
-
47
-
48
-
49
-
50
-
51
-
52
-
53
-
54
-
55
-
56
-
57
-
58
-
59
-
60
-
61
-
62
-
63
-
64
-
65
-
66
-
67
-
68
-
69
-
70
-
 71
71 -
 72
72 -
 73
73 -
 74
74 -
 75
75 -
 76
76 -
 77
77 -
 78
78 -
 79
79 -
 80
80 -
 81
81 -
 82
82 -
 83
83 -
 84
84 -
 85
85 -
 86
86 -
 87
87 -
 88
88 -
 89
89 -
 90
90 -
 91
91 -
92
-
93
-
94
-
95
-
96
-
97
-
98
-
99
-
100
-
101
-
102
-
103
-
104
-
105
-
106
-
107
-
108
-
109
-
110
-
111
-
112
-
113
-
114
-
115
-
116
-
117
-
118
-
119
-
120
-
121
-
122
-
123
-
124
-
125
-
126
-
127
-
128
-
129
-
130
-
131
-
132
-
133
-
134
-
135
-
136
-
137
-
138
-
139
-
140
-
141
-
142
-
143
-
144
-
145
-
146
-
147
-
148
-
149
-
150
-
151
-
152
-
153
-
154
-
155
-
156
-
157
-
158
-
159
-
160
-
161
-
162
-
163
-
164
-
165
-
166
-
167
-
168
-
169
-
170
-
171
-
172
-
173
-
174
-
175
-
176
-
177
-
178
-
179
-
180
-
181
-
182
-
183
-
184
-
185
-
186
-
187
-
188
-
189
-
190
-
191
-
192
-
193
-
194
-
195
-
196
-
197
-
198
-
199
-
200
-
201
-
202
-
203
-
204
-
205
-
206
-
207
-
208
-
209
-
210
-
211
-
212
-
213
-
214
-
215
-
216
-
217
-
218
-
219
-
220
-
221
-
222
-
223
-
224
-
225
-
226
-
227
-
228
-
229
-
230
-
231
-
232
-
233
-
234
-
235
-
236
-
237
-
238
-
239
-
240
-
241
-
242
-
243
-
244
-
245
-
246
-
247
-
248
-
249
-
250
-
251
-
252
-
253
-
254
-
255
-
256
-
257
-
258
-
259
-
260
-
261
-
262
-
263
-
264
-
265
-
266
-
267
-
268
 |
 |

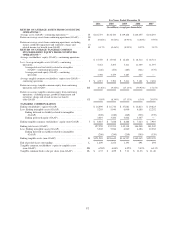
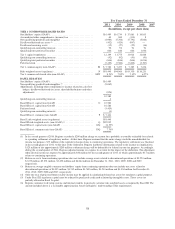
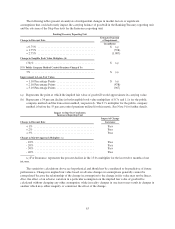
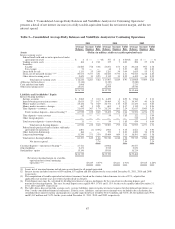
For Years Ended December 31
2011 2010 2009 2008 2007
(In millions, except per share data)
RETURN ON AVERAGE ASSETS FROM CONTINUING
OPERATIONS (2)
Average assets (GAAP)—continuing operations (2) ........... H $126,719 $ 132,720 $ 139,468 $ 140,455 $ 134,693
Return on average assets from continuing operations (GAAP) . . . B/
H (0.02%) (0.52%) (0.93%) (4.04%) 0.95%
Return on average assets from continuing operations, excluding
merger, goodwill impairment and regulatory charge and
related income tax benefit (non-GAAP) ..................
C/
H 0.17% (0.46%) (0.93%) 0.32% 1.12%
RETURN ON AVERAGE TANGIBLE COMMON
STOCKHOLDERS’ EQUITY FROM CONTINUING
OPERATIONS (3)
Average stockholders’ equity (GAAP)—continuing operations
(3) ................................................. $ 15,350 $ 15,916 $ 16,224 $ 18,514 $ 18,721
Less: Average intangible assets (GAAP)—continuing
operations .......................................... 5,261 5,295 5,411 11,309 11,597
Average deferred tax liability related to intangibles
(GAAP)—continuing operations .................... (226) (254) (285) (321) (370)
Average preferred equity (GAAP)—continuing
operations ...................................... 3,398 3,479 3,487 425 —
Average tangible common stockholders’ equity (non-GAAP)—
continuing operations ................................. I $ 6,917 $ 7,396 $ 7,611 $ 7,101 $ 7,494
Return on average tangible common equity from continuing
operations (non-GAAP) ............................... B/I (0.36%) (9.36%) (17.13%) (79.92%) 17.15%
Return on average tangible common equity from continuing
operations, excluding merger, goodwill impairment and
regulatory charge and related income tax benefit
(non-GAAP) ........................................ C/I 3.05% (8.34%) (17.13%) 6.34% 20.07%
TANGIBLE COMMON RATIOS
Ending stockholders’ equity (GAAP) .................... $ 16,499 $ 16,734 $ 17,881 $ 16,813 $ 19,823
Less: Ending intangible assets (GAAP) ................... 5,265 5,946 6,060 6,186 12,252
Ending deferred tax liability related to intangibles
(GAAP) ..................................... (200) (240) (269) (303) (339)
Ending preferred equity (GAAP) .................... 3,419 3,380 3,602 3,307 —
Ending tangible common stockholders’ equity (non-GAAP) . . J $ 8,015 $ 7,648 $ 8,488 $ 7,623 $ 7,910
Ending total assets (GAAP) ............................ 127,050 132,351 142,318 146,248 141,042
Less: Ending intangible assets (GAAP) ................... 5,265 5,946 6,060 6,186 12,252
Ending deferred tax liability related to intangibles
(GAAP) ..................................... (200) (240) (269) (303) (339)
Ending tangible assets (non-GAAP) ..................... K $121,985 $126,645 $136,527 $140,365 $129,129
End of period shares outstanding ........................ L 1,259 1,256 1,193 691 694
Tangible common stockholders’ equity to tangible assets
(non-GAAP) ...................................... J/K 6.58% 6.04% 6.22% 5.43% 6.13%
Tangible common book value per share (non-GAAP) ....... J/L $ 6.37 $ 6.09 $ 7.11 $ 11.03 $ 11.40
57