RBS 2008 Annual Report Download - page 100
Download and view the complete annual report
Please find page 100 of the 2008 RBS annual report below. You can navigate through the pages in the report by either clicking on the pages listed below, or by using the keyword search tool below to find specific information within the annual report.-
 1
1 -
2
-
3
-
4
-
5
-
6
-
7
-
8
-
9
-
10
-
11
-
12
-
13
-
14
-
15
-
16
-
17
-
18
-
19
-
20
-
21
-
22
-
23
-
24
-
25
-
26
-
27
-
28
-
29
-
30
-
31
-
32
-
33
-
34
-
35
-
36
-
37
-
38
-
39
-
40
-
41
-
42
-
43
-
44
-
45
-
46
-
47
-
48
-
49
-
50
-
51
-
52
-
53
-
54
-
55
-
56
-
57
-
58
-
59
-
60
-
61
-
62
-
63
-
64
-
65
-
66
-
67
-
68
-
69
-
70
-
71
-
72
-
73
-
74
-
75
-
76
-
77
-
78
-
79
-
80
-
81
-
82
-
83
-
84
-
85
-
86
-
87
-
88
-
89
-
 90
90 -
 91
91 -
 92
92 -
 93
93 -
 94
94 -
 95
95 -
 96
96 -
 97
97 -
 98
98 -
 99
99 -
 100
100 -
 101
101 -
 102
102 -
 103
103 -
 104
104 -
 105
105 -
 106
106 -
 107
107 -
 108
108 -
 109
109 -
 110
110 -
111
-
112
-
113
-
114
-
115
-
116
-
117
-
118
-
119
-
120
-
121
-
122
-
123
-
124
-
125
-
126
-
127
-
128
-
129
-
130
-
131
-
132
-
133
-
134
-
135
-
136
-
137
-
138
-
139
-
140
-
141
-
142
-
143
-
144
-
145
-
146
-
147
-
148
-
149
-
150
-
151
-
152
-
153
-
154
-
155
-
156
-
157
-
158
-
159
-
160
-
161
-
162
-
163
-
164
-
165
-
166
-
167
-
168
-
169
-
170
-
171
-
172
-
173
-
174
-
175
-
176
-
177
-
178
-
179
-
180
-
181
-
182
-
183
-
184
-
185
-
186
-
187
-
188
-
189
-
190
-
191
-
192
-
193
-
194
-
195
-
196
-
197
-
198
-
199
-
200
-
201
-
202
-
203
-
204
-
205
-
206
-
207
-
208
-
209
-
210
-
211
-
212
-
213
-
214
-
215
-
216
-
217
-
218
-
219
-
220
-
221
-
222
-
223
-
224
-
225
-
226
-
227
-
228
-
229
-
230
-
231
-
232
-
233
-
234
-
235
-
236
-
237
-
238
-
239
-
240
-
241
-
242
-
243
-
244
-
245
-
246
-
247
-
248
-
249
-
250
-
251
-
252
-
253
-
254
-
255
-
256
-
257
-
258
-
259
-
260
-
261
-
262
-
263
-
264
-
265
-
266
-
267
-
268
-
269
-
270
-
271
-
272
-
273
-
274
-
275
-
276
-
277
-
278
-
279
-
280
-
281
-
282
-
283
-
284
-
285
-
286
-
287
-
288
-
289
-
290
-
291
-
292
-
293
-
294
-
295
-
296
-
297
-
298
-
299
 |
 |

99RBS Group Annual Report and Accounts 2008
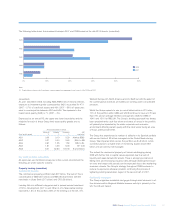
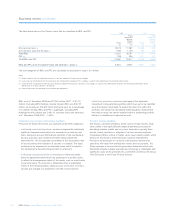
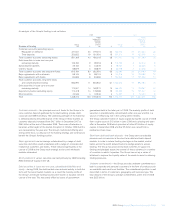
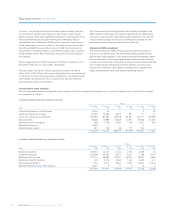
Impairment (audited)
The Group classifies impaired assets as either Risk Elements in Lending
(REIL) or Potential Problem Loans (PPL). REIL represents non-accrual
loans, loans that are accruing but are past due 90 days and
restructured loans. PPL represents impaired assets which are not
included in REIL but where information about possible credit problems
cause management to have serious doubts about the future ability of
the borrower to comply with loan repayment terms.
Both REIL and PPL are reported gross of the value of any security held,
which could reduce the eventual loss should it occur, and gross of any
provision marked. Therefore impaired assets which are highly
collateralised, such as mortgages, will have a low coverage ratio of
provisions held against reported impaired balance.
The analyses of risk elements and impairment charges as discussed
below form a key part of the data provided to senior management on
the credit performance of the Group’s portfolios.
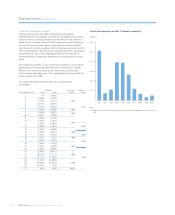
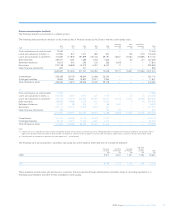
Risk elements in lending and potential problem loans (audited)
2008 2007
Total Total
Total provision Total provision
provision as % of provision as % of
REIL and Total as % of REIL & REIL and Total as % of REIL &
REIL PPL PPL provision REIL PPL REIL PPL PPL provision REIL PPL
Division £m £m £m £m %%£m £m £m £m %%
Global Markets
– Global Banking & Markets 6,192 18 6,210 3,491 56% 56% 952 67 1,019 586 62% 58%
– Global Transaction Services 284 — 284 245 86% 86% 336 — 336 170 51% 51%
Total Global Markets 6,476 18 6,494 3,736 58% 58% 1,288 67 1,355 756 59% 56%
Regional Markets
– UK Retail &
Commercial Banking 7,900 200 8,100 3,709 47% 46% 5,535 63 5,598 3,281 59% 59%
– US Retail &
Commercial Banking 770 — 770 932 121% 121% 317 — 317 304 96% 96%
– Europe & Middle East Retail
& Commercial Banking 3,341 8 3,349 822 25% 25% 725 1 726 418 58% 58%
– Asia Retail &
Commercial Banking 304 — 304 252 83% 83% 386 — 386 183 47% 47%
Total Regional Markets 12,315 208 12,523 5,715 46% 46% 6,963 64 7,027 4,186 60% 60%
Other —————————14 ——
RBS share of shared assets —————————16 ——
Group before RFS Holdings
minority interest 18,791 226 19,017 9,451 50% 50% 8,251 131 8,382 4,972 60% 59%
RFS Holdings minority interest 2,470 — 2,470 1,565 63% 63% 2,480 540 3,020 1,480 60% 49%
Group 21,261 226 21,487 11,016 52% 51% 10,731 671 11,402 6,452 60% 57%