RBS 2008 Annual Report Download - page 36
Download and view the complete annual report
Please find page 36 of the 2008 RBS annual report below. You can navigate through the pages in the report by either clicking on the pages listed below, or by using the keyword search tool below to find specific information within the annual report.-
 1
1 -
2
-
3
-
4
-
5
-
6
-
7
-
8
-
9
-
10
-
11
-
12
-
13
-
14
-
15
-
16
-
17
-
18
-
19
-
20
-
21
-
22
-
23
-
24
-
25
-
 26
26 -
 27
27 -
 28
28 -
 29
29 -
 30
30 -
 31
31 -
 32
32 -
 33
33 -
 34
34 -
 35
35 -
 36
36 -
 37
37 -
 38
38 -
 39
39 -
 40
40 -
 41
41 -
 42
42 -
 43
43 -
 44
44 -
 45
45 -
 46
46 -
47
-
48
-
49
-
50
-
51
-
52
-
53
-
54
-
55
-
56
-
57
-
58
-
59
-
60
-
61
-
62
-
63
-
64
-
65
-
66
-
67
-
68
-
69
-
70
-
71
-
72
-
73
-
74
-
75
-
76
-
77
-
78
-
79
-
80
-
81
-
82
-
83
-
84
-
85
-
86
-
87
-
88
-
89
-
90
-
91
-
92
-
93
-
94
-
95
-
96
-
97
-
98
-
99
-
100
-
101
-
102
-
103
-
104
-
105
-
106
-
107
-
108
-
109
-
110
-
111
-
112
-
113
-
114
-
115
-
116
-
117
-
118
-
119
-
120
-
121
-
122
-
123
-
124
-
125
-
126
-
127
-
128
-
129
-
130
-
131
-
132
-
133
-
134
-
135
-
136
-
137
-
138
-
139
-
140
-
141
-
142
-
143
-
144
-
145
-
146
-
147
-
148
-
149
-
150
-
151
-
152
-
153
-
154
-
155
-
156
-
157
-
158
-
159
-
160
-
161
-
162
-
163
-
164
-
165
-
166
-
167
-
168
-
169
-
170
-
171
-
172
-
173
-
174
-
175
-
176
-
177
-
178
-
179
-
180
-
181
-
182
-
183
-
184
-
185
-
186
-
187
-
188
-
189
-
190
-
191
-
192
-
193
-
194
-
195
-
196
-
197
-
198
-
199
-
200
-
201
-
202
-
203
-
204
-
205
-
206
-
207
-
208
-
209
-
210
-
211
-
212
-
213
-
214
-
215
-
216
-
217
-
218
-
219
-
220
-
221
-
222
-
223
-
224
-
225
-
226
-
227
-
228
-
229
-
230
-
231
-
232
-
233
-
234
-
235
-
236
-
237
-
238
-
239
-
240
-
241
-
242
-
243
-
244
-
245
-
246
-
247
-
248
-
249
-
250
-
251
-
252
-
253
-
254
-
255
-
256
-
257
-
258
-
259
-
260
-
261
-
262
-
263
-
264
-
265
-
266
-
267
-
268
-
269
-
270
-
271
-
272
-
273
-
274
-
275
-
276
-
277
-
278
-
279
-
280
-
281
-
282
-
283
-
284
-
285
-
286
-
287
-
288
-
289
-
290
-
291
-
292
-
293
-
294
-
295
-
296
-
297
-
298
-
299
 |
 |

35RBS Group Annual Report and Accounts 2008
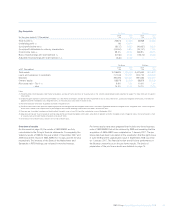
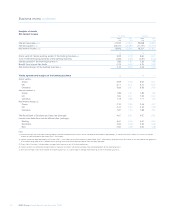
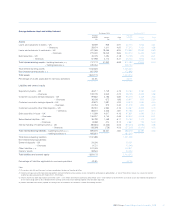
Key financials
Pro forma Statutory
2008 2007 2008 2007
for the year ended 31 December £m £m £m £m
Total income (1) 26,875 33,564 25,868 30,366
Underlying profit (2) 80 10,314 ——
(Loss)/profit before tax (3) (8,127) 8,962 (40,667) 9,832
(Loss)/profit attributable to ordinary shareholders (24,051) 6,823 (24,137) 7,303
Cost:income ratio (4) 59.2% 49.5% 208.9% 45.9%
Basic (loss)/earnings per share (pence) (5) (61.0p) 40.8p (145.7p) 64.0p
Adjusted (loss)/earnings per share (pence) (5, 6) (5.2p) 44.5p ——
Pro forma Statutory
2008 2007 2008 2007
at 31 December £m £m £m £m
Total assets 2,218,693 1,595,066 2,401,652 1,840,829
Loans and advances to customers 731,165 700,191 874,722 828,538
Deposits 780,395 860,621 897,556 994,657
Owners’ equity 58,879 53,038 58,879 53,038
Risk asset ratio – Tier 1 (7) 9.9% 7.0% 10.0% 7.3%
– total 14.2% 11.3% 14.1% 11.2%
Notes:
(1) Pro forma total income excludes credit market write-downs and one-off items and share of shared assets. In the statutory consolidated income statement on page 174, these items are included in
total income.
(2) Underlying profit represents pro forma profit before tax, credit market write-downs and one-off items impairment losses on reclassified assets, purchased intangibles amortisation, write-down of
goodwill and other intangible assets, integration costs, restructuring costs and share of shared assets.
(3) Pro forma excludes write-down of goodwill and other intangible assets.
(4) Pro forma cost:income ratio represents operating expenses excluding purchased intangibles amortisation, write-down of goodwill and other intangible assets, integration costs, restructuring costs
and share of shared assets expressed as a percentage of total income excluding credit market write-downs and one-off items.
(5) Prior year per share data have been restated to reflect the rights issue in June 2008 and the capitalisation issue in September 2008.
(6) Adjusted earnings per share is based on earnings adjusted for purchased intangibles amortisation, write-down of goodwill and other intangible assets, integration costs, restructuring costs, share
of shared assets and credit market write-downs and one-off items.
(7) 2008 data are on a Basel II basis; data for 2007 are on a Basel I basis.
Overview of results
As discussed on page 24, the results of ABN AMRO are fully
consolidated in the Group’s financial statements. Consequently, the
statutory results of RBS for the year ended 31 December 2007 and
2008 include the results of ABN AMRO for 76 days and the full year
respectively. The interests of the State of the Netherlands and
Santander in RFS Holdings are included in minority interests.
Pro forma results have been prepared that include only those business
units of ABN AMRO that will be retained by RBS and assuming that the
acquisition of ABN AMRO was completed on 1 January 2007. The per
share data have been calculated on the assumption that the rights issue
in June 2008 and the capitalisation issue in September 2008 occurred
on 1 January 2007. The financial review and divisional performance in
the Business review focus on the pro forma results. The basis of
preparation of the pro forma results are detailed on page 74.