RBS 2008 Annual Report Download - page 114
Download and view the complete annual report
Please find page 114 of the 2008 RBS annual report below. You can navigate through the pages in the report by either clicking on the pages listed below, or by using the keyword search tool below to find specific information within the annual report.-
 1
1 -
2
-
3
-
4
-
5
-
6
-
7
-
8
-
9
-
10
-
11
-
12
-
13
-
14
-
15
-
16
-
17
-
18
-
19
-
20
-
21
-
22
-
23
-
24
-
25
-
26
-
27
-
28
-
29
-
30
-
31
-
32
-
33
-
34
-
35
-
36
-
37
-
38
-
39
-
40
-
41
-
42
-
43
-
44
-
45
-
46
-
47
-
48
-
49
-
50
-
51
-
52
-
53
-
54
-
55
-
56
-
57
-
58
-
59
-
60
-
61
-
62
-
63
-
64
-
65
-
66
-
67
-
68
-
69
-
70
-
71
-
72
-
73
-
74
-
75
-
76
-
77
-
78
-
79
-
80
-
81
-
82
-
83
-
84
-
85
-
86
-
87
-
88
-
89
-
90
-
91
-
92
-
93
-
94
-
95
-
96
-
97
-
98
-
99
-
100
-
101
-
102
-
103
-
 104
104 -
 105
105 -
 106
106 -
 107
107 -
 108
108 -
 109
109 -
 110
110 -
 111
111 -
 112
112 -
 113
113 -
 114
114 -
 115
115 -
 116
116 -
 117
117 -
 118
118 -
 119
119 -
 120
120 -
 121
121 -
 122
122 -
 123
123 -
 124
124 -
125
-
126
-
127
-
128
-
129
-
130
-
131
-
132
-
133
-
134
-
135
-
136
-
137
-
138
-
139
-
140
-
141
-
142
-
143
-
144
-
145
-
146
-
147
-
148
-
149
-
150
-
151
-
152
-
153
-
154
-
155
-
156
-
157
-
158
-
159
-
160
-
161
-
162
-
163
-
164
-
165
-
166
-
167
-
168
-
169
-
170
-
171
-
172
-
173
-
174
-
175
-
176
-
177
-
178
-
179
-
180
-
181
-
182
-
183
-
184
-
185
-
186
-
187
-
188
-
189
-
190
-
191
-
192
-
193
-
194
-
195
-
196
-
197
-
198
-
199
-
200
-
201
-
202
-
203
-
204
-
205
-
206
-
207
-
208
-
209
-
210
-
211
-
212
-
213
-
214
-
215
-
216
-
217
-
218
-
219
-
220
-
221
-
222
-
223
-
224
-
225
-
226
-
227
-
228
-
229
-
230
-
231
-
232
-
233
-
234
-
235
-
236
-
237
-
238
-
239
-
240
-
241
-
242
-
243
-
244
-
245
-
246
-
247
-
248
-
249
-
250
-
251
-
252
-
253
-
254
-
255
-
256
-
257
-
258
-
259
-
260
-
261
-
262
-
263
-
264
-
265
-
266
-
267
-
268
-
269
-
270
-
271
-
272
-
273
-
274
-
275
-
276
-
277
-
278
-
279
-
280
-
281
-
282
-
283
-
284
-
285
-
286
-
287
-
288
-
289
-
290
-
291
-
292
-
293
-
294
-
295
-
296
-
297
-
298
-
299
 |
 |

113RBS Group Annual Report and Accounts 2008
In addition to VaR, the following measures are reported to CFG ALCO,
Group Treasury, GALCO and the Board:
•The sensitivity of net accrual earnings to a variety of parallel and
non-parallel movements in interest rates.
•Economic value of equity (EVE) sensitivity to a series of parallel
movements in interest rates. EVE is only used within CFG and to meet
the FSA prescribed standard shock test of +/- 200bp parallel shock.
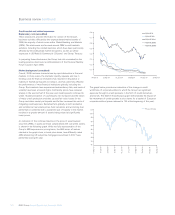
The interest rate sensitivities in the table above are illustrative only and
are based on simplified scenarios.
The figures represent the effect on pro forma net interest income of
movements of the yield curve based on the Group’s current non-trading
interest rate risk profile. This effect however does not incorporate
actions that would be taken by the business units to mitigate the effect
of this interest rate risk. In reality the business units proactively seek
to change the interest rate risk profile to minimise losses and optimise
net revenues.
The projections also assume that interest rates of all maturities move by
the same amount and therefore do not reflect the potential effect on net
interest income of some rates changing whilst others remain the same.
The projections do not take into account the effect on net interest
income of anticipated differences in changes between interest rates
and interest rates linked to other bases (such as central bank rates or
product rates for which the entity has discretion over the timing and
extent of rate changes). The projections make other simplifying
assumptions, including that all positions run to maturity and that there
are no negative interest rates.
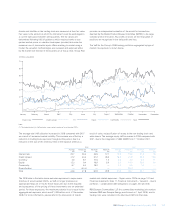
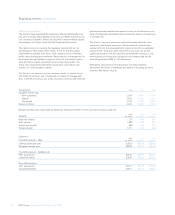
Sensitivity of net interest income (unaudited)
There have been no material changes to the Group`s measurement and
management of the sensitivity of net interest income to movement in
interest rates.
The Group aims, through its management of market risk in non-trading
portfolios, to mitigate the effect of prospective interest movements
which could reduce future net interest income, whilst balancing the cost
of such hedging activities on the current net revenue stream.
The table below sets out the effect on future net interest income of a
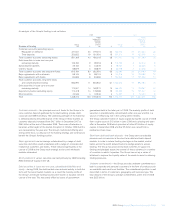
sustained +/-100bp parallel rise/fall in all yield curves.
Year 1
£m
+ 100bp shift in yield curves 138.9
– 100bp shift in yield curves (234.1)
Percent increase/
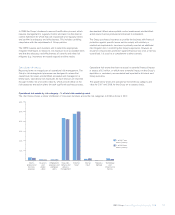
decrease in CFG EVE(1)
2% parallel
downward
2% parallel movement in
upward US interest
movement in rates (No
US interest negative rates
(unaudited) rates allowed)
Period end (0.7) (19.0)
Maximum (18.2) (20.8)
Minimum (0.7) (4.4)
Average (12.2) (12.6)
Note:
(1) Economic value of equity is the net present value of assets and liabilities calculated by discounting expected cash flows of each instrument over its expected life. Risk to EVE is quantified by
calculating the impact of interest rate changes on the net present value of equity and is expressed as a percentage of CFG regulatory capital.