RBS 2008 Annual Report Download - page 56
Download and view the complete annual report
Please find page 56 of the 2008 RBS annual report below. You can navigate through the pages in the report by either clicking on the pages listed below, or by using the keyword search tool below to find specific information within the annual report.-
 1
1 -
2
-
3
-
4
-
5
-
6
-
7
-
8
-
9
-
10
-
11
-
12
-
13
-
14
-
15
-
16
-
17
-
18
-
19
-
20
-
21
-
22
-
23
-
24
-
25
-
26
-
27
-
28
-
29
-
30
-
31
-
32
-
33
-
34
-
35
-
36
-
37
-
38
-
39
-
40
-
41
-
42
-
43
-
44
-
45
-
 46
46 -
 47
47 -
 48
48 -
 49
49 -
 50
50 -
 51
51 -
 52
52 -
 53
53 -
 54
54 -
 55
55 -
 56
56 -
 57
57 -
 58
58 -
 59
59 -
 60
60 -
 61
61 -
 62
62 -
 63
63 -
 64
64 -
 65
65 -
 66
66 -
67
-
68
-
69
-
70
-
71
-
72
-
73
-
74
-
75
-
76
-
77
-
78
-
79
-
80
-
81
-
82
-
83
-
84
-
85
-
86
-
87
-
88
-
89
-
90
-
91
-
92
-
93
-
94
-
95
-
96
-
97
-
98
-
99
-
100
-
101
-
102
-
103
-
104
-
105
-
106
-
107
-
108
-
109
-
110
-
111
-
112
-
113
-
114
-
115
-
116
-
117
-
118
-
119
-
120
-
121
-
122
-
123
-
124
-
125
-
126
-
127
-
128
-
129
-
130
-
131
-
132
-
133
-
134
-
135
-
136
-
137
-
138
-
139
-
140
-
141
-
142
-
143
-
144
-
145
-
146
-
147
-
148
-
149
-
150
-
151
-
152
-
153
-
154
-
155
-
156
-
157
-
158
-
159
-
160
-
161
-
162
-
163
-
164
-
165
-
166
-
167
-
168
-
169
-
170
-
171
-
172
-
173
-
174
-
175
-
176
-
177
-
178
-
179
-
180
-
181
-
182
-
183
-
184
-
185
-
186
-
187
-
188
-
189
-
190
-
191
-
192
-
193
-
194
-
195
-
196
-
197
-
198
-
199
-
200
-
201
-
202
-
203
-
204
-
205
-
206
-
207
-
208
-
209
-
210
-
211
-
212
-
213
-
214
-
215
-
216
-
217
-
218
-
219
-
220
-
221
-
222
-
223
-
224
-
225
-
226
-
227
-
228
-
229
-
230
-
231
-
232
-
233
-
234
-
235
-
236
-
237
-
238
-
239
-
240
-
241
-
242
-
243
-
244
-
245
-
246
-
247
-
248
-
249
-
250
-
251
-
252
-
253
-
254
-
255
-
256
-
257
-
258
-
259
-
260
-
261
-
262
-
263
-
264
-
265
-
266
-
267
-
268
-
269
-
270
-
271
-
272
-
273
-
274
-
275
-
276
-
277
-
278
-
279
-
280
-
281
-
282
-
283
-
284
-
285
-
286
-
287
-
288
-
289
-
290
-
291
-
292
-
293
-
294
-
295
-
296
-
297
-
298
-
299
 |
 |

55RBS Group Annual Report and Accounts 2008
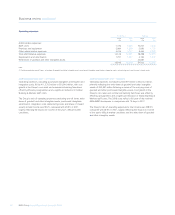
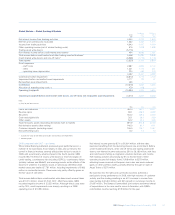
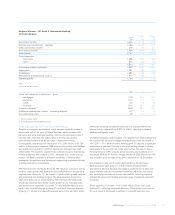
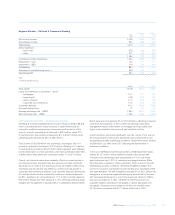
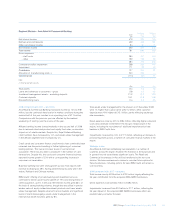
Regional Markets – UK Retail & Commercial Banking
UK Retail Banking
Pro forma Statutory
2008 2007 2007
£m £m £m
Net interest income 4,390 4,172 4,172
Net fees and commissions – banking 2,186 2,351 2,351
Other non-interest income* 218 271 271
Non–interest income 2,404 2,622 2,622
Total income 6,794 6,794 6,794
Direct expenses
– staff costs 1,258 1,266 1,266
– other 574 545 545
1,832 1,811 1,811
Contribution before impairment 4,962 4,983 4,983
Impairment 1,281 1,184 1,184
Contribution 3,681 3,799 3,799
Allocation of manufacturing costs (1) 1,917 1,792 —
Operating profit 1,764 2,007 3,799
Note:
(1) Only for pro forma results.
£bn £bn £bn
Loans and advances to customers – gross
– mortgages 74.9 67.4 67.4
– personal 16.2 17.1 17.1
– cards 6.4 7.8 7.8
– business 20.0 18.7 18.7
Customer deposits** 95.9 96.1 96.1
Investment management assets – excluding deposits 5.7 7.0 7.0
Non-performing loans 4.8 4.3 4.3
* net of insurance claims
** customer deposits exclude bancassurance
2008 compared with 2007 – pro forma and statutory
Despite an economic environment which became markedly weaker in
the second half of the year, UK Retail Banking, which includes both
personal and small business banking, held income and direct costs in
line with 2007. However the deterioration in the macroeconomic
environment resulted in an 8% increase in impairment losses.
Consequently, operating profit decreased 12%, £243 million, to £1,764
million. In the personal segment, RBS retained top position and NatWest
was again joint second for customer satisfaction amongst main high
street banks. The business segment has continued to grow, maintaining
market leadership with a share of 26%, alongside 23% of the start-up
market. UK Retail continues to maintain availability of lending while
managing risk exposure and focusing on supporting customers through
a difficult economic environment.
Net interest income increased 5% to £4,390 million as a result of strong
balance sheet growth. Net interest income performance in the personal
segment was strong, up 7%, as a result of good volume growth coupled
with improving new lending margins. The small business sector has
seen more pressure on asset margins, from increased funding costs,
which has restricted net interest income growth to 4%. Average loans
and advances to customers increased 7% and average deposits were
up 6% with personal savings growing 9% and small business deposits
growing 3%. At year end deposit balances were in line with 2007 levels,
reflecting increasing competitive pressure in a slowing market. Net
interest margin reduced from 3.92% to 3.85%, reflecting increased
funding and liquidity costs.
UK Retail mortgage balances grew 11% despite more muted demand in
the second half, and net mortgage lending market share increased to
19% (2007 – 2%). Small business lending grew 7% despite a significant
contraction in demand. Personal unsecured lending slowed, however,
particularly in the second half of the year. Further, the sale of Tesco
Personal Finance (TPF) reduced personal unsecured balances at 31
December 2008 by £1.9 billion, though income of £285 million from TPF
was included up to the date of the sale completion on 19 December.
Non-interest income net of claims declined 8% to £2,404 million.
Bancassurance sales grew 3% to £353 million annual premium
equivalent in the year however the negative performance of debt and
equity markets reduced investment income by £48 million. Excluding
this, underlying non-interest income declined 6% reflecting reduced
demand for unsecured lending and lower sales of payment protection
insurance.
Direct expenses increased 1% to £1,832 million. Direct staff costs
reduced 1% reflecting increased efficiency. Other direct costs rose by
5% as a result of increased investment in selected business lines.