RBS 2008 Annual Report Download - page 225
Download and view the complete annual report
Please find page 225 of the 2008 RBS annual report below. You can navigate through the pages in the report by either clicking on the pages listed below, or by using the keyword search tool below to find specific information within the annual report.-
 1
1 -
2
-
3
-
4
-
5
-
6
-
7
-
8
-
9
-
10
-
11
-
12
-
13
-
14
-
15
-
16
-
17
-
18
-
19
-
20
-
21
-
22
-
23
-
24
-
25
-
26
-
27
-
28
-
29
-
30
-
31
-
32
-
33
-
34
-
35
-
36
-
37
-
38
-
39
-
40
-
41
-
42
-
43
-
44
-
45
-
46
-
47
-
48
-
49
-
50
-
51
-
52
-
53
-
54
-
55
-
56
-
57
-
58
-
59
-
60
-
61
-
62
-
63
-
64
-
65
-
66
-
67
-
68
-
69
-
70
-
71
-
72
-
73
-
74
-
75
-
76
-
77
-
78
-
79
-
80
-
81
-
82
-
83
-
84
-
85
-
86
-
87
-
88
-
89
-
90
-
91
-
92
-
93
-
94
-
95
-
96
-
97
-
98
-
99
-
100
-
101
-
102
-
103
-
104
-
105
-
106
-
107
-
108
-
109
-
110
-
111
-
112
-
113
-
114
-
115
-
116
-
117
-
118
-
119
-
120
-
121
-
122
-
123
-
124
-
125
-
126
-
127
-
128
-
129
-
130
-
131
-
132
-
133
-
134
-
135
-
136
-
137
-
138
-
139
-
140
-
141
-
142
-
143
-
144
-
145
-
146
-
147
-
148
-
149
-
150
-
151
-
152
-
153
-
154
-
155
-
156
-
157
-
158
-
159
-
160
-
161
-
162
-
163
-
164
-
165
-
166
-
167
-
168
-
169
-
170
-
171
-
172
-
173
-
174
-
175
-
176
-
177
-
178
-
179
-
180
-
181
-
182
-
183
-
184
-
185
-
186
-
187
-
188
-
189
-
190
-
191
-
192
-
193
-
194
-
195
-
196
-
197
-
198
-
199
-
200
-
201
-
202
-
203
-
204
-
205
-
206
-
207
-
208
-
209
-
210
-
211
-
212
-
213
-
214
-
 215
215 -
 216
216 -
 217
217 -
 218
218 -
 219
219 -
 220
220 -
 221
221 -
 222
222 -
 223
223 -
 224
224 -
 225
225 -
 226
226 -
 227
227 -
 228
228 -
 229
229 -
 230
230 -
 231
231 -
 232
232 -
 233
233 -
 234
234 -
 235
235 -
236
-
237
-
238
-
239
-
240
-
241
-
242
-
243
-
244
-
245
-
246
-
247
-
248
-
249
-
250
-
251
-
252
-
253
-
254
-
255
-
256
-
257
-
258
-
259
-
260
-
261
-
262
-
263
-
264
-
265
-
266
-
267
-
268
-
269
-
270
-
271
-
272
-
273
-
274
-
275
-
276
-
277
-
278
-
279
-
280
-
281
-
282
-
283
-
284
-
285
-
286
-
287
-
288
-
289
-
290
-
291
-
292
-
293
-
294
-
295
-
296
-
297
-
298
-
299
 |
 |

RBS Group Annual Report and Accounts 2008224
Notes on the accounts continued
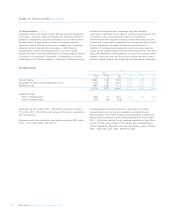
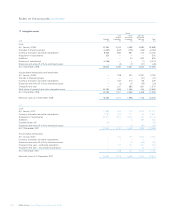
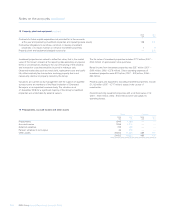
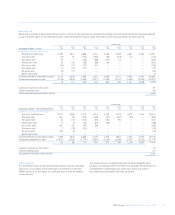
18 Property, plant and equipment (continued)
2008 2007
£m £m
Contracts for future capital expenditure not provided for in the accounts
at the year end (excluding investment properties and operating lease assets) 128 201
Contractual obligations to purchase, construct or develop investment
properties or to repair, maintain or enhance investment properties 7 9
Property, plant and equipment pledged as security — 935
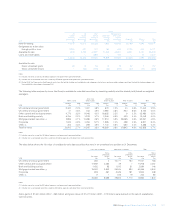
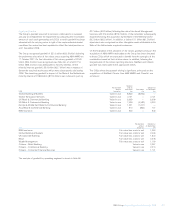
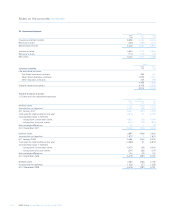
19 Prepayments, accrued income and other assets
Group Company
2008 2007 2008 2007
£m £m £m £m
Prepayments 1,949 1,988 ——
Accrued income 1,206 1,214 ——
Deferred expenses 709 385 ——
Pension schemes in net surplus 36 575 ——
Other assets 20,502 11,500 489 127
24,402 15,662 489 127
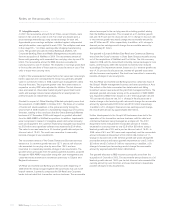
Investment properties are valued to reflect fair value, that is, the market
value of the Group’s interest at the reporting date excluding any special
terms or circumstances relating to the use or financing of the property
and transaction costs that would be incurred in making a sale.
Observed market data such as rental yield, replacement cost and useful
life, reflect relatively few transactions involving property that is not
necessarily identical to property owned by the Group.
Valuations are carried out by management with the support of qualified
surveyors who are members of the Royal Institution of Chartered
Surveyors, or an equivalent overseas body. The valuation as at
31 December 2008 for a significant majority of the Group’s investment
properties was undertaken by external valuers.
The fair value of investment properties includes £172 million (2007 –
£234 million) of appreciation since purchase.
Rental income from investment properties was £257 million (2007 –
£300 million; 2006 – £278 million). Direct operating expenses of
investment properties were £22 million (2007 – £49 million; 2006 –
£54 million).
Property, plant and equipment, excluding investment properties, include
£1,132 million (2007 – £717 million) assets in the course of
construction.
Freehold and long leasehold properties with a net book value of nil
(2007 – £451 million; 2006 – £164 million) were sold subject to
operating leases.