RBS 2008 Annual Report Download - page 202
Download and view the complete annual report
Please find page 202 of the 2008 RBS annual report below. You can navigate through the pages in the report by either clicking on the pages listed below, or by using the keyword search tool below to find specific information within the annual report.-
 1
1 -
2
-
3
-
4
-
5
-
6
-
7
-
8
-
9
-
10
-
11
-
12
-
13
-
14
-
15
-
16
-
17
-
18
-
19
-
20
-
21
-
22
-
23
-
24
-
25
-
26
-
27
-
28
-
29
-
30
-
31
-
32
-
33
-
34
-
35
-
36
-
37
-
38
-
39
-
40
-
41
-
42
-
43
-
44
-
45
-
46
-
47
-
48
-
49
-
50
-
51
-
52
-
53
-
54
-
55
-
56
-
57
-
58
-
59
-
60
-
61
-
62
-
63
-
64
-
65
-
66
-
67
-
68
-
69
-
70
-
71
-
72
-
73
-
74
-
75
-
76
-
77
-
78
-
79
-
80
-
81
-
82
-
83
-
84
-
85
-
86
-
87
-
88
-
89
-
90
-
91
-
92
-
93
-
94
-
95
-
96
-
97
-
98
-
99
-
100
-
101
-
102
-
103
-
104
-
105
-
106
-
107
-
108
-
109
-
110
-
111
-
112
-
113
-
114
-
115
-
116
-
117
-
118
-
119
-
120
-
121
-
122
-
123
-
124
-
125
-
126
-
127
-
128
-
129
-
130
-
131
-
132
-
133
-
134
-
135
-
136
-
137
-
138
-
139
-
140
-
141
-
142
-
143
-
144
-
145
-
146
-
147
-
148
-
149
-
150
-
151
-
152
-
153
-
154
-
155
-
156
-
157
-
158
-
159
-
160
-
161
-
162
-
163
-
164
-
165
-
166
-
167
-
168
-
169
-
170
-
171
-
172
-
173
-
174
-
175
-
176
-
177
-
178
-
179
-
180
-
181
-
182
-
183
-
184
-
185
-
186
-
187
-
188
-
189
-
190
-
191
-
 192
192 -
 193
193 -
 194
194 -
 195
195 -
 196
196 -
 197
197 -
 198
198 -
 199
199 -
 200
200 -
 201
201 -
 202
202 -
 203
203 -
 204
204 -
 205
205 -
 206
206 -
 207
207 -
 208
208 -
 209
209 -
 210
210 -
 211
211 -
 212
212 -
213
-
214
-
215
-
216
-
217
-
218
-
219
-
220
-
221
-
222
-
223
-
224
-
225
-
226
-
227
-
228
-
229
-
230
-
231
-
232
-
233
-
234
-
235
-
236
-
237
-
238
-
239
-
240
-
241
-
242
-
243
-
244
-
245
-
246
-
247
-
248
-
249
-
250
-
251
-
252
-
253
-
254
-
255
-
256
-
257
-
258
-
259
-
260
-
261
-
262
-
263
-
264
-
265
-
266
-
267
-
268
-
269
-
270
-
271
-
272
-
273
-
274
-
275
-
276
-
277
-
278
-
279
-
280
-
281
-
282
-
283
-
284
-
285
-
286
-
287
-
288
-
289
-
290
-
291
-
292
-
293
-
294
-
295
-
296
-
297
-
298
-
299
 |
 |

201RBS Group Annual Report and Accounts 2008
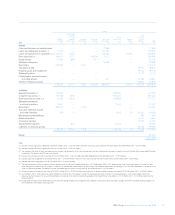
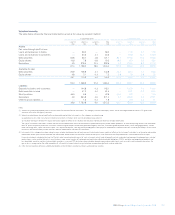
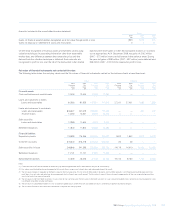
Valuation hierarchy
The table below shows the financial instruments carried at fair value by valuation method.
31 December 2008 31 December 2007
Level 1(1) Level 2 (2) Level 3 (3) Total Level 1(1) Level 2 (2) Level 3(3) Total
£bn £bn £bn £bn £bn £bn £bn £bn
Assets
Fair value through profit or loss:
Loans and advances to banks — 56.2 — 56.2 — 71.5 0.1 71.6
Loans and advances to customers — 50.5 3.1 53.6 — 93.8 13.1 106.9
Debt securities 52.8 65.1 3.8 121.7 83.1 101.8 11.6 196.5
Equity shares 10.6 7.8 0.8 19.2 36.5 8.0 0.9 45.4
Derivatives 3.9 978.4 10.3 992.6 1.9 270.3 5.2 277.4
67.3 1,158.0 18.0 1,243.3 121.5 545.4 30.9 697.8
Available-for-sale:
Debt securities 20.9 108.8 3.1 132.8 32.1 62.3 1.1 95.5
Equity shares 4.8 2.1 0.3 7.2 5.8 1.0 0.8 7.6
25.7 110.9 3.4 140.0 37.9 63.3 1.9 103.1
93.0 1,268.9 21.4 1,383.3 159.4 608.7 32.8 800.9
Liabilities
Deposits by banks and customers — 144.8 0.3 145.1 — 132.0 1.4 133.4
Debt securities in issue — 47.0 4.4 51.4 — 42.1 9.2 51.3
Short positions 36.0 6.5 — 42.5 63.6 9.9 — 73.5
Derivatives 3.6 963.8 4.0 971.4 2.1 265.6 4.4 272.1
Other financial liabilities (4) — 1.5 0.3 1.8 — 0.9 0.2 1.1
39.6 1,163.8 9.0 1,212.2 65.7 450.5 15.2 531.4
Notes:
(1) Valued using unadjusted quoted prices in active markets for identical financial instruments. This category includes listed equity shares, certain exchange-traded derivatives, G10 government
securities and certain US agency securities.
(2) Valued using techniques based significantly on observable market data. Instruments in this category are valued using:
(a) quoted prices for similar instruments or identical instruments in markets which are not considered to be active; or
(b) valuation techniques where all the inputs that have a significant effect on the valuation are directly or indirectly based on observable market data.
The type of instruments that trade in markets that are not considered to be active, but are based on quoted market prices, broker dealer quotations, or alternative pricing sources with reasonable
levels of price transparency and those instruments valued using techniques include most government agency securities, investment-grade corporate bonds, certain mortgage products, certain
bank and bridge loans, repos and reverse repos, less liquid listed equities, state and municipal obligations, most physical commodities, investment contracts issued by the Group’s life assurance
businesses and certain money market securities and loan commitments and most OTC derivatives.
(3) Instruments in this category have been valued using a valuation technique where at least one input (which could have a significant effect on the instrument’s valuation) is not based on observable
market data. Where inputs can be observed from market data without undue cost and effort, the observed input is used. Otherwise, the Group determines a reasonable level for the input.
Financial instruments included within level 3 of the fair value hierarchy primarily consist of cash instruments which trade infrequently, certain syndicated and commercial mortgage loans, unlisted
equity shares, certain residual interests in securitisations, super senior tranches of high grade and mezzanine collateralised debt obligations (CDOs), and other mortgage-based products and
less liquid debt securities, certain structured debt securities in issue and OTC derivatives where valuation depends upon unobservable inputs such as certain credit and exotic derivatives. No
gain or loss is recognised on the initial recognition of a financial instrument valued using a technique incorporating significant unobservable data.
(4) Other financial liabilities comprise subordinated liabilities and write downs relating to undrawn syndicated loan facilities.