RBS 2008 Annual Report Download - page 108
Download and view the complete annual report
Please find page 108 of the 2008 RBS annual report below. You can navigate through the pages in the report by either clicking on the pages listed below, or by using the keyword search tool below to find specific information within the annual report.-
 1
1 -
2
-
3
-
4
-
5
-
6
-
7
-
8
-
9
-
10
-
11
-
12
-
13
-
14
-
15
-
16
-
17
-
18
-
19
-
20
-
21
-
22
-
23
-
24
-
25
-
26
-
27
-
28
-
29
-
30
-
31
-
32
-
33
-
34
-
35
-
36
-
37
-
38
-
39
-
40
-
41
-
42
-
43
-
44
-
45
-
46
-
47
-
48
-
49
-
50
-
51
-
52
-
53
-
54
-
55
-
56
-
57
-
58
-
59
-
60
-
61
-
62
-
63
-
64
-
65
-
66
-
67
-
68
-
69
-
70
-
71
-
72
-
73
-
74
-
75
-
76
-
77
-
78
-
79
-
80
-
81
-
82
-
83
-
84
-
85
-
86
-
87
-
88
-
89
-
90
-
91
-
92
-
93
-
94
-
95
-
96
-
97
-
 98
98 -
 99
99 -
 100
100 -
 101
101 -
 102
102 -
 103
103 -
 104
104 -
 105
105 -
 106
106 -
 107
107 -
 108
108 -
 109
109 -
 110
110 -
 111
111 -
 112
112 -
 113
113 -
 114
114 -
 115
115 -
 116
116 -
 117
117 -
 118
118 -
119
-
120
-
121
-
122
-
123
-
124
-
125
-
126
-
127
-
128
-
129
-
130
-
131
-
132
-
133
-
134
-
135
-
136
-
137
-
138
-
139
-
140
-
141
-
142
-
143
-
144
-
145
-
146
-
147
-
148
-
149
-
150
-
151
-
152
-
153
-
154
-
155
-
156
-
157
-
158
-
159
-
160
-
161
-
162
-
163
-
164
-
165
-
166
-
167
-
168
-
169
-
170
-
171
-
172
-
173
-
174
-
175
-
176
-
177
-
178
-
179
-
180
-
181
-
182
-
183
-
184
-
185
-
186
-
187
-
188
-
189
-
190
-
191
-
192
-
193
-
194
-
195
-
196
-
197
-
198
-
199
-
200
-
201
-
202
-
203
-
204
-
205
-
206
-
207
-
208
-
209
-
210
-
211
-
212
-
213
-
214
-
215
-
216
-
217
-
218
-
219
-
220
-
221
-
222
-
223
-
224
-
225
-
226
-
227
-
228
-
229
-
230
-
231
-
232
-
233
-
234
-
235
-
236
-
237
-
238
-
239
-
240
-
241
-
242
-
243
-
244
-
245
-
246
-
247
-
248
-
249
-
250
-
251
-
252
-
253
-
254
-
255
-
256
-
257
-
258
-
259
-
260
-
261
-
262
-
263
-
264
-
265
-
266
-
267
-
268
-
269
-
270
-
271
-
272
-
273
-
274
-
275
-
276
-
277
-
278
-
279
-
280
-
281
-
282
-
283
-
284
-
285
-
286
-
287
-
288
-
289
-
290
-
291
-
292
-
293
-
294
-
295
-
296
-
297
-
298
-
299
 |
 |

107RBS Group Annual Report and Accounts 2008
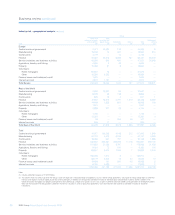
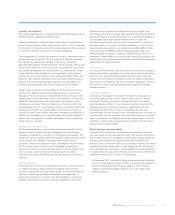
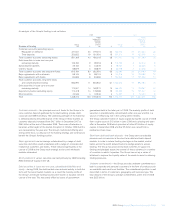
The tables above show the timing of cash inflows and outflows to settle
financial assets and liabilities. They have been prepared on the following
basis:
Financial assets have been reflected in the time band of the latest date
on which they could be repaid unless earlier repayment can be
demanded by the reporting entity; financial liabilities are included at the
earliest date on which the counterparty can require repayment
regardless of whether or not such early repayment results in a penalty. If
the repayment of a financial asset or liability is triggered by, or is
subject to, specific criteria such as market price hurdles being reached,
the asset is included in the latest date on which it can repay regardless
of early repayment whereas the liability is included at the earliest
possible date that the conditions could be fulfilled without considering
the probability of the conditions being met. For example, if a structured
note is automatically prepaid when an equity index exceeds a certain
level, the cash outflow will be included in the less than three months
period whatever the level of the index at the year end. The settlement
date of debt securities in issue issued by certain securitisation vehicles
consolidated by the Group depends on when cash flows are received
from the securitised assets. Where these assets are prepayable, the
timing of the cash outflow relating to securities assumes that each asset
will be prepaid at the earliest possible date. As the repayment of assets
and liabilities are linked, the repayment of assets in securitisations are
shown on the earliest date that the asset can be prepaid as this is the
basis used for liabilities.
Assets and liabilities with a contractual maturity of greater than 20
years – the principal amounts of financial assets and liabilities that are
repayable after 20 years or where the counterparty has no right to
repayment of the principal are excluded from the table as are interest
payments after 20 years.
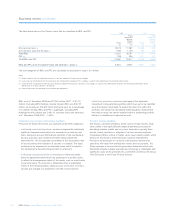
Held-for-trading assets and liabilities – held-for-trading assets and
liabilities amounting to £1,226.8 billion (assets) and £1,146.7 billion
(liabilities) (2007 – £678.6 billion assets, £478.6 billion liabilities) have
been excluded from the table in view of their short term nature.
This contractual analysis highlights the maturity transformation of the
balance sheet that is fundamental to the structure of banking. In
practice, this is not a reflection of the actual behaviour of assets or
liabilities. In particular the customer funding of the balance sheet
exhibits much greater stability and maturity than the tables indicate. This
is because the funding franchise of the Group is diversified across an
extensive retail network.
Regulatory environment (audited)
The Group is subject to the FSA’s liquidity regime, whilst overseas
subsidiaries and branches are subject to local regimes.
Sterling liquidity
The FSA requires the Group, on a consolidated basis, to maintain daily
a minimum ratio of 100% between:
•a stock of qualifying high quality liquid assets (primarily UK and EU
government securities, treasury bills and cash held in branches); and
•the sum of: sterling wholesale net outflows contractually due within
five working days (offset up to a limit of 50%, by 85% of sterling
certificates of deposit held which mature beyond five working days);
and 5% of retail deposits with a residual contractual maturity of five
working days or less. The FSA also sets an absolute minimum level for
the stock of qualifying liquid assets that the Group is required to
maintain each day.
Given the developments in 2008 the FSA has published new proposals
for liquidity management (CP08/22) to replace the current regulatory
framework. The FSA is proposing a major overhaul of liquidity risk
regulation that will include:
•Improved systems and controls including governance standards,
pricing, intra day systems and collateral management.
•Individual liquid assessments that will include mandatory scenarios
and an analysis of principal liquidity exposure factors.
•Reporting standards improved both in scope and frequency by
enhanced mismatch reporting.
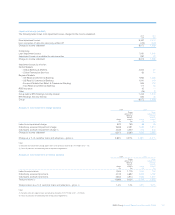
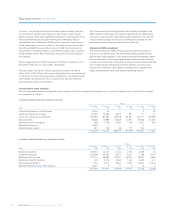
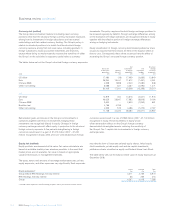
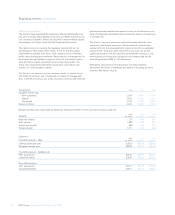
Other contractual cash obligations
The table below summarises the Group’s other contractual cash obligations by payment date.
Group
0-3 months 3-12 months 1-3 years 3-5 years 5-10 years 10-20 years
2008 £m £m £m £m £m £m
Operating leases 146 433 976 751 1,448 1,851
Contractual obligations to purchase goods or services 237 892 486 208 303 1
383 1,325 1,462 959 1,751 1,852
2007
Operating leases 90 268 655 569 1,060 1,958
Contractual obligations to purchase goods or services 441 1,007 748 199 52
531 1,275 1,403 768 1,065 1,960
The Group’s undrawn formal facilities, credit lines and other commitments to lend were £352,398 million (2007 – £332,811 million). While the Group
has given commitments to provide these funds, some facilities may be subject to certain conditions being met by the counterparty. The Group does
not expect all facilities to be drawn, and some may lapse before drawdown.