RBS 2008 Annual Report Download - page 55
Download and view the complete annual report
Please find page 55 of the 2008 RBS annual report below. You can navigate through the pages in the report by either clicking on the pages listed below, or by using the keyword search tool below to find specific information within the annual report.-
 1
1 -
2
-
3
-
4
-
5
-
6
-
7
-
8
-
9
-
10
-
11
-
12
-
13
-
14
-
15
-
16
-
17
-
18
-
19
-
20
-
21
-
22
-
23
-
24
-
25
-
26
-
27
-
28
-
29
-
30
-
31
-
32
-
33
-
34
-
35
-
36
-
37
-
38
-
39
-
40
-
41
-
42
-
43
-
44
-
 45
45 -
 46
46 -
 47
47 -
 48
48 -
 49
49 -
 50
50 -
 51
51 -
 52
52 -
 53
53 -
 54
54 -
 55
55 -
 56
56 -
 57
57 -
 58
58 -
 59
59 -
 60
60 -
 61
61 -
 62
62 -
 63
63 -
 64
64 -
 65
65 -
66
-
67
-
68
-
69
-
70
-
71
-
72
-
73
-
74
-
75
-
76
-
77
-
78
-
79
-
80
-
81
-
82
-
83
-
84
-
85
-
86
-
87
-
88
-
89
-
90
-
91
-
92
-
93
-
94
-
95
-
96
-
97
-
98
-
99
-
100
-
101
-
102
-
103
-
104
-
105
-
106
-
107
-
108
-
109
-
110
-
111
-
112
-
113
-
114
-
115
-
116
-
117
-
118
-
119
-
120
-
121
-
122
-
123
-
124
-
125
-
126
-
127
-
128
-
129
-
130
-
131
-
132
-
133
-
134
-
135
-
136
-
137
-
138
-
139
-
140
-
141
-
142
-
143
-
144
-
145
-
146
-
147
-
148
-
149
-
150
-
151
-
152
-
153
-
154
-
155
-
156
-
157
-
158
-
159
-
160
-
161
-
162
-
163
-
164
-
165
-
166
-
167
-
168
-
169
-
170
-
171
-
172
-
173
-
174
-
175
-
176
-
177
-
178
-
179
-
180
-
181
-
182
-
183
-
184
-
185
-
186
-
187
-
188
-
189
-
190
-
191
-
192
-
193
-
194
-
195
-
196
-
197
-
198
-
199
-
200
-
201
-
202
-
203
-
204
-
205
-
206
-
207
-
208
-
209
-
210
-
211
-
212
-
213
-
214
-
215
-
216
-
217
-
218
-
219
-
220
-
221
-
222
-
223
-
224
-
225
-
226
-
227
-
228
-
229
-
230
-
231
-
232
-
233
-
234
-
235
-
236
-
237
-
238
-
239
-
240
-
241
-
242
-
243
-
244
-
245
-
246
-
247
-
248
-
249
-
250
-
251
-
252
-
253
-
254
-
255
-
256
-
257
-
258
-
259
-
260
-
261
-
262
-
263
-
264
-
265
-
266
-
267
-
268
-
269
-
270
-
271
-
272
-
273
-
274
-
275
-
276
-
277
-
278
-
279
-
280
-
281
-
282
-
283
-
284
-
285
-
286
-
287
-
288
-
289
-
290
-
291
-
292
-
293
-
294
-
295
-
296
-
297
-
298
-
299
 |
 |

RBS Group Annual Report and Accounts 200854
Business review continued
2008 compared with 2007 – pro forma and statutory
UK Retail and Commercial Banking retains an extremely strong
franchise and represents the core of the RBS Group. However, the
external environment over the next few years will present significant
challenges with pressure on income as a result of very low interest
rates, lower fee income, and impairment costs likely to increase further.
The business plans to respond to this environment through reducing
costs and increasing productivity by investing in online service
channels, automation of activities and re-design of end-to-end
processes. The business will tailor the cost of service for different client
segments more closely to their value generation.
Wealth management remains a strong growth opportunity and the
business plans to pursue a more consolidated approach to the market
through more co-ordination across the multiple brands with which it
currently faces the market, whilst investing in additional Relationship
Managers and platform functionality.
The division will pursue above market growth in customer deposits to
improve its funding contribution to the Group, and will diversify its
customer lending, reducing its exposure to commercial property.
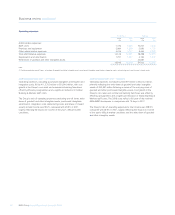
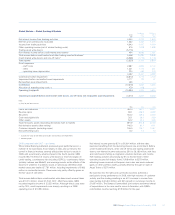
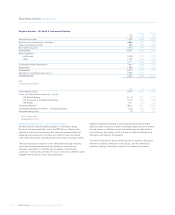
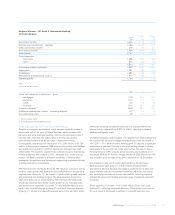
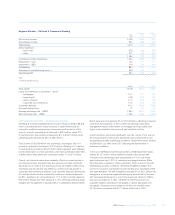
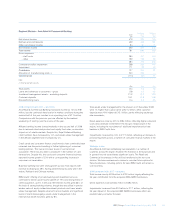
Regional Markets – UK Retail & Commercial Banking
Pro forma Statutory
2008 2007 2007
£m £m £m
Net interest income 7,090 6,668 6,668
Net fees and commissions – banking 2,886 3,030 3,030
Other non-interest income* 838 890 890
Non–interest income 3,724 3,920 3,920
Total income 10,814 10,588 10,588
Direct expenses
– staff costs 1,978 1,919 1,919
– other 1,193 1,076 1,076
3,171 2,995 2,995
Contribution before impairment 7,643 7,593 7,593
Impairment 1,964 1,368 1,368
Contribution 5,679 6,225 6,225
Allocation of manufacturing costs (1) 2,396 2,240 —
Operating profit 3,283 3,985 6,225
Note:
(1) Only for pro forma results.
£bn £bn £bn
Total banking assets 249.4 232.8 232.8
Loans and advances to customers – gross
– UK Retail Banking 117.5 111.0 111.0
– UK Corporate & Commercial Banking 110.4 99.3 99.3
– UK Wealth 10.1 8.4 8.4
Customer deposits** 186.1 189.4 189.4
Investment management assets – excluding deposits 22.5 25.8 25.8
Non-performing loans 7.9 5.5 5.5
* net of insurance claims
** excluding bancassurance