RBS 2008 Annual Report Download - page 37
Download and view the complete annual report
Please find page 37 of the 2008 RBS annual report below. You can navigate through the pages in the report by either clicking on the pages listed below, or by using the keyword search tool below to find specific information within the annual report.-
 1
1 -
2
-
3
-
4
-
5
-
6
-
7
-
8
-
9
-
10
-
11
-
12
-
13
-
14
-
15
-
16
-
17
-
18
-
19
-
20
-
21
-
22
-
23
-
24
-
25
-
26
-
 27
27 -
 28
28 -
 29
29 -
 30
30 -
 31
31 -
 32
32 -
 33
33 -
 34
34 -
 35
35 -
 36
36 -
 37
37 -
 38
38 -
 39
39 -
 40
40 -
 41
41 -
 42
42 -
 43
43 -
 44
44 -
 45
45 -
 46
46 -
 47
47 -
48
-
49
-
50
-
51
-
52
-
53
-
54
-
55
-
56
-
57
-
58
-
59
-
60
-
61
-
62
-
63
-
64
-
65
-
66
-
67
-
68
-
69
-
70
-
71
-
72
-
73
-
74
-
75
-
76
-
77
-
78
-
79
-
80
-
81
-
82
-
83
-
84
-
85
-
86
-
87
-
88
-
89
-
90
-
91
-
92
-
93
-
94
-
95
-
96
-
97
-
98
-
99
-
100
-
101
-
102
-
103
-
104
-
105
-
106
-
107
-
108
-
109
-
110
-
111
-
112
-
113
-
114
-
115
-
116
-
117
-
118
-
119
-
120
-
121
-
122
-
123
-
124
-
125
-
126
-
127
-
128
-
129
-
130
-
131
-
132
-
133
-
134
-
135
-
136
-
137
-
138
-
139
-
140
-
141
-
142
-
143
-
144
-
145
-
146
-
147
-
148
-
149
-
150
-
151
-
152
-
153
-
154
-
155
-
156
-
157
-
158
-
159
-
160
-
161
-
162
-
163
-
164
-
165
-
166
-
167
-
168
-
169
-
170
-
171
-
172
-
173
-
174
-
175
-
176
-
177
-
178
-
179
-
180
-
181
-
182
-
183
-
184
-
185
-
186
-
187
-
188
-
189
-
190
-
191
-
192
-
193
-
194
-
195
-
196
-
197
-
198
-
199
-
200
-
201
-
202
-
203
-
204
-
205
-
206
-
207
-
208
-
209
-
210
-
211
-
212
-
213
-
214
-
215
-
216
-
217
-
218
-
219
-
220
-
221
-
222
-
223
-
224
-
225
-
226
-
227
-
228
-
229
-
230
-
231
-
232
-
233
-
234
-
235
-
236
-
237
-
238
-
239
-
240
-
241
-
242
-
243
-
244
-
245
-
246
-
247
-
248
-
249
-
250
-
251
-
252
-
253
-
254
-
255
-
256
-
257
-
258
-
259
-
260
-
261
-
262
-
263
-
264
-
265
-
266
-
267
-
268
-
269
-
270
-
271
-
272
-
273
-
274
-
275
-
276
-
277
-
278
-
279
-
280
-
281
-
282
-
283
-
284
-
285
-
286
-
287
-
288
-
289
-
290
-
291
-
292
-
293
-
294
-
295
-
296
-
297
-
298
-
299
 |
 |

RBS Group Annual Report and Accounts 200836
Business review continued
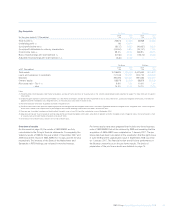
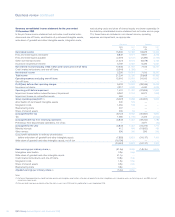
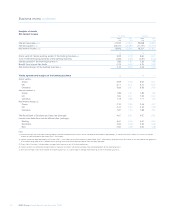
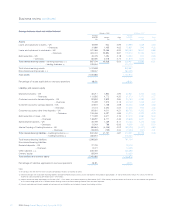
Summary consolidated income statement for the year ended
31 December 2008
In the pro forma income statement set out below credit market write-
downs and one-off items, amortisation of purchased intangible assets,
write-down of goodwill and other intangible assets, integration costs,
restructuring costs and share of shared assets are shown separately. In
the statutory consolidated income statement set out below and on page
174, these items are included in non-interest income, operating
expenses and impairment, as appropriate.
Pro forma Statutory
2008 2007 2008 2007
£m £m £m £m
Net interest income 15,939 12,382 18,675 12,069
Fees and commissions receivable 8,839 9,171 9,831 8,278
Fees and commissions payable (2,391) (2,147) (2,386) (2,193)
Other non-interest income (1,221) 8,176 (6,578) 6,125
Insurance net premium income 5,709 5,982 6,326 6,087
Non-interest income excluding credit market write-downs and one-off items 10,936 21,182 7,193 18,297
Credit market write-downs and one-off items (5,641) (1,268) ——
Non-interest income 5,295 19,914 7,193 18,297
Total income 21,234 32,296 25,868 30,366
Operating expenses excluding one-off items 15,916 16,618 54,033 13,942
One-off items — (242) ——
Profit/(loss) before other operating charges 5,318 15,920 (28,165) 16,424
Insurance net claims 3,917 4,528 4,430 4,624
Operating profit before impairment 1,401 11,392 (32,595) 11,800
Impairment losses before reclassified asset impairment 6,962 2,104 8,072 1,968
Impairment losses on reclassified assets 466 ———
Group operating (loss)/profit (1) (6,027) 9,288 (40,667) 9,832
Amortisation of purchased intangible assets 443 124 ——
Integration costs 1,050 108 ——
Restructuring costs 307 ———
Share of shared assets 300 94 ——
(Loss)/profit before tax (8,127) 8,962 (40,667) 9,832
Tax 1,280 (1,709) 2,323 (2,044)
(Loss)/profit after tax from continuing operations (6,847) 7,253 (38,344) 7,788
Profit/(loss) from discontinued operations, net of tax — —3,971 (76)
(Loss)/profit for the year (6,847) 7,253 (34,373) 7,712
Minority interests 412 184 (10,832) 163
Other owners 596 246 596 246
(Loss)/profit attributable to ordinary shareholders
before write-down of goodwill and other intangible assets (7,855) 6,823 (24,137) 7,303
Write-down of goodwill and other intangible assets, net of tax (16,196) ———
(24,051) 6,823 (24,137) 7,303
Basic earnings per ordinary share (2) (61.0p) 40.8p (145.7p) 64.0p
Intangibles amortisation 0.9p 0.6p
Write-down of goodwill and other intangible assets 41.1p —
Credit market write-downs and one-off items 10.8p 2.4p
Integration costs 1.9p 0.5p
Share of shared assets 0.5p 0.2p
Restructuring costs 0.6p —
Adjusted earnings per ordinary share (2) (5.2p) 44.5p
Notes:
(1) Pro forma Group operating (loss)/profit excludes purchased intangibles amortisation, write-down of goodwill and other intangible assets, integration costs, restructuring costs and RBS share of
consortium shared assets.
(2) Prior year data have been restated to reflect the rights issue in June 2008 and the capitalisation issue in September 2008.