RBS 2008 Annual Report Download - page 276
Download and view the complete annual report
Please find page 276 of the 2008 RBS annual report below. You can navigate through the pages in the report by either clicking on the pages listed below, or by using the keyword search tool below to find specific information within the annual report.-
 1
1 -
2
-
3
-
4
-
5
-
6
-
7
-
8
-
9
-
10
-
11
-
12
-
13
-
14
-
15
-
16
-
17
-
18
-
19
-
20
-
21
-
22
-
23
-
24
-
25
-
26
-
27
-
28
-
29
-
30
-
31
-
32
-
33
-
34
-
35
-
36
-
37
-
38
-
39
-
40
-
41
-
42
-
43
-
44
-
45
-
46
-
47
-
48
-
49
-
50
-
51
-
52
-
53
-
54
-
55
-
56
-
57
-
58
-
59
-
60
-
61
-
62
-
63
-
64
-
65
-
66
-
67
-
68
-
69
-
70
-
71
-
72
-
73
-
74
-
75
-
76
-
77
-
78
-
79
-
80
-
81
-
82
-
83
-
84
-
85
-
86
-
87
-
88
-
89
-
90
-
91
-
92
-
93
-
94
-
95
-
96
-
97
-
98
-
99
-
100
-
101
-
102
-
103
-
104
-
105
-
106
-
107
-
108
-
109
-
110
-
111
-
112
-
113
-
114
-
115
-
116
-
117
-
118
-
119
-
120
-
121
-
122
-
123
-
124
-
125
-
126
-
127
-
128
-
129
-
130
-
131
-
132
-
133
-
134
-
135
-
136
-
137
-
138
-
139
-
140
-
141
-
142
-
143
-
144
-
145
-
146
-
147
-
148
-
149
-
150
-
151
-
152
-
153
-
154
-
155
-
156
-
157
-
158
-
159
-
160
-
161
-
162
-
163
-
164
-
165
-
166
-
167
-
168
-
169
-
170
-
171
-
172
-
173
-
174
-
175
-
176
-
177
-
178
-
179
-
180
-
181
-
182
-
183
-
184
-
185
-
186
-
187
-
188
-
189
-
190
-
191
-
192
-
193
-
194
-
195
-
196
-
197
-
198
-
199
-
200
-
201
-
202
-
203
-
204
-
205
-
206
-
207
-
208
-
209
-
210
-
211
-
212
-
213
-
214
-
215
-
216
-
217
-
218
-
219
-
220
-
221
-
222
-
223
-
224
-
225
-
226
-
227
-
228
-
229
-
230
-
231
-
232
-
233
-
234
-
235
-
236
-
237
-
238
-
239
-
240
-
241
-
242
-
243
-
244
-
245
-
246
-
247
-
248
-
249
-
250
-
251
-
252
-
253
-
254
-
255
-
256
-
257
-
258
-
259
-
260
-
261
-
262
-
263
-
264
-
265
-
 266
266 -
 267
267 -
 268
268 -
 269
269 -
 270
270 -
 271
271 -
 272
272 -
 273
273 -
 274
274 -
 275
275 -
 276
276 -
 277
277 -
 278
278 -
 279
279 -
 280
280 -
 281
281 -
 282
282 -
 283
283 -
 284
284 -
 285
285 -
 286
286 -
287
-
288
-
289
-
290
-
291
-
292
-
293
-
294
-
295
-
296
-
297
-
298
-
299
 |
 |

275RBS Group Annual Report and Accounts 2008
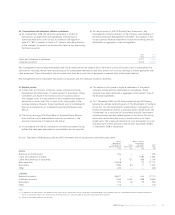
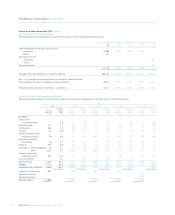
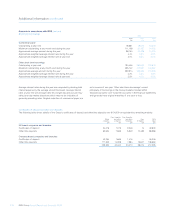
Analysis of deposits – product analysis
The following table shows the distribution of the Group’s deposits by type and geographical area.
IFRS
2008 2007 2006
£m £m £m
UK
Domestic:
Demand deposits – interest-free 43,376 43,721 39,149
– interest-bearing 107,159 121,343 118,315
Time deposits – savings 88,434 41,185 31,656
– other 130,951 207,263 80,496
Overseas residents:
Demand deposits – interest-free 907 563 573
– interest-bearing 16,320 25,129 37,729
Time deposits – savings 1,819 605 1,122
– other 67,477 87,437 51,568
Total UK offices 456,443 527,246 360,608
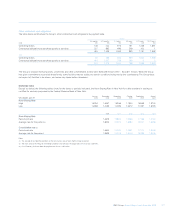
Overseas
Demand deposits – interest-free 29,253 27,959 12,173
– interest-bearing 92,354 70,758 27,441
Time deposits – savings 68,014 52,381 19,049
– other 251,492 316,313 97,094
Total overseas offices 441,113 467,411 155,757
Total deposits 897,556 994,657 516,365
Held-for-trading 137,080 125,917 104,249
Designated as at fair value through profit or loss 8,054 7,505 3,922
Amortised cost 752,422 861,235 408,194
Total deposits 897,556 994,657 516,365
Overseas
US 153,163 152,324 115,121
Rest of the World 287,950 315,087 40,636
Total overseas offices 441,113 467,411 155,757