RBS 2008 Annual Report Download - page 204
Download and view the complete annual report
Please find page 204 of the 2008 RBS annual report below. You can navigate through the pages in the report by either clicking on the pages listed below, or by using the keyword search tool below to find specific information within the annual report.-
 1
1 -
2
-
3
-
4
-
5
-
6
-
7
-
8
-
9
-
10
-
11
-
12
-
13
-
14
-
15
-
16
-
17
-
18
-
19
-
20
-
21
-
22
-
23
-
24
-
25
-
26
-
27
-
28
-
29
-
30
-
31
-
32
-
33
-
34
-
35
-
36
-
37
-
38
-
39
-
40
-
41
-
42
-
43
-
44
-
45
-
46
-
47
-
48
-
49
-
50
-
51
-
52
-
53
-
54
-
55
-
56
-
57
-
58
-
59
-
60
-
61
-
62
-
63
-
64
-
65
-
66
-
67
-
68
-
69
-
70
-
71
-
72
-
73
-
74
-
75
-
76
-
77
-
78
-
79
-
80
-
81
-
82
-
83
-
84
-
85
-
86
-
87
-
88
-
89
-
90
-
91
-
92
-
93
-
94
-
95
-
96
-
97
-
98
-
99
-
100
-
101
-
102
-
103
-
104
-
105
-
106
-
107
-
108
-
109
-
110
-
111
-
112
-
113
-
114
-
115
-
116
-
117
-
118
-
119
-
120
-
121
-
122
-
123
-
124
-
125
-
126
-
127
-
128
-
129
-
130
-
131
-
132
-
133
-
134
-
135
-
136
-
137
-
138
-
139
-
140
-
141
-
142
-
143
-
144
-
145
-
146
-
147
-
148
-
149
-
150
-
151
-
152
-
153
-
154
-
155
-
156
-
157
-
158
-
159
-
160
-
161
-
162
-
163
-
164
-
165
-
166
-
167
-
168
-
169
-
170
-
171
-
172
-
173
-
174
-
175
-
176
-
177
-
178
-
179
-
180
-
181
-
182
-
183
-
184
-
185
-
186
-
187
-
188
-
189
-
190
-
191
-
192
-
193
-
 194
194 -
 195
195 -
 196
196 -
 197
197 -
 198
198 -
 199
199 -
 200
200 -
 201
201 -
 202
202 -
 203
203 -
 204
204 -
 205
205 -
 206
206 -
 207
207 -
 208
208 -
 209
209 -
 210
210 -
 211
211 -
 212
212 -
 213
213 -
 214
214 -
215
-
216
-
217
-
218
-
219
-
220
-
221
-
222
-
223
-
224
-
225
-
226
-
227
-
228
-
229
-
230
-
231
-
232
-
233
-
234
-
235
-
236
-
237
-
238
-
239
-
240
-
241
-
242
-
243
-
244
-
245
-
246
-
247
-
248
-
249
-
250
-
251
-
252
-
253
-
254
-
255
-
256
-
257
-
258
-
259
-
260
-
261
-
262
-
263
-
264
-
265
-
266
-
267
-
268
-
269
-
270
-
271
-
272
-
273
-
274
-
275
-
276
-
277
-
278
-
279
-
280
-
281
-
282
-
283
-
284
-
285
-
286
-
287
-
288
-
289
-
290
-
291
-
292
-
293
-
294
-
295
-
296
-
297
-
298
-
299
 |
 |

203RBS Group Annual Report and Accounts 2008
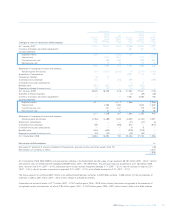
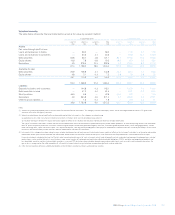
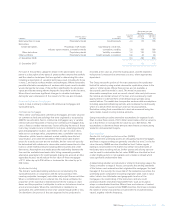
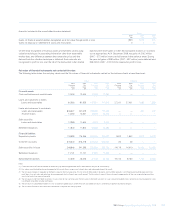
Reasonably possible
alternative assumptions
Carrying Increase Decrease
Valuation basis/ Main amount fair value fair value
Liabilities technique assumptions £bn £m £m
Debt securities in issue Proprietary model Credit spreads 4.4 170 190
Derivatives
Credit derivatives Proprietary CVA model, Counterparty credit risk,
industry option models, correlation model correlation, volatility 2.6 160 180
Other derivatives Proprietary model Volatility, correlation 1.4 120 120
Other portfolios Proprietary model Credit spreads, correlation 0.6 40 60
31 December 2008 9.0 490 550
31 December 2007 15.3 120 120
For each of the portfolio categories shown in the above table, set out
below is a description of the types of products that comprise the portfolio
and the valuation techniques that are applied in determining fair value,
including a description of valuation techniques used, including for those
in level 2, and inputs to those models and techniques. Where reasonably
possible alternative assumptions of unobservable inputs used in models
would change the fair value of the portfolio significantly, the alternative
inputs are indicated along with the impact this would have on the fair value.
Where there have been significant changes to valuation techniques
during the year a discussion of the reasons for this are also included.
Loans and advances to customers
Loans in level 3 primarily comprise US commercial mortgages and
syndicated loans.
Commercial mortgages
These senior and mezzanine commercial mortgages are loans secured
on commercial land and buildings that were originated or acquired by
GBM for securitisation. Senior commercial mortgages carry a variable
interest rate and mezzanine or more junior commercial mortgages may
carry a fixed or variable interest rate. Factors affecting the value of these
loans may include, but are not limited to, loan type, underlying property
type and geographic location, loan interest rate, loan to value ratios,
debt service coverage ratios, prepayment rates, cumulative loan loss
information, yields, investor demand, market volatility since the last
securitisation, and credit enhancement. Where observable market
prices for a particular loan are not available, the fair value will typically
be determined with reference to observable market transactions in other
loans or credit related products including debt securities and credit
derivatives. Assumptions are made about the relationship between the
loan and the available benchmark data. Using reasonably possible
alternative assumptions for credit spreads (taking into account all other
applicable factors) would reduce the fair value of these mortgages
of £1.1 billion by up to £18 million or increase the fair value by up to
£25 million.
Syndicated lending
The Group’s syndicated lending activities are conducted by the
syndicate business in conjunction with the various product lines
covering corporate, leveraged, real estate and project finance activities.
When a commitment to lend is entered into, the Group estimates the
proportion of the loan that is intended to be held for trading on draw
down, and the proportion it anticipates to retain on its balance sheet as
a loan and receivable. Where the commitment is intended to be
syndicated, the commitment to lend is fair valued through profit or loss.
On drawdown, the portion of the loan expected to be syndicated is
recorded at fair value as a held-for-trading asset, and the expected
hold portion is measured at amortised cost less, where appropriate,
impairment.
The Group values the portion of the loan expected to be syndicated
held at fair value by using market observable syndication prices in the
same or similar assets. Where these prices are not available, a
discounted cash flow model is used. The model incorporates
observable assumptions such as current interest rates and yield curves,
the notional and tender amount of the loan, and counterparty credit
quality where it is derived from credit default swap spreads using
market indices. The model also incorporates unobservable assumptions,
including expected refinancing periods, and counterparty credit quality
where it is derived from the Group’s internal risk assessments.
Derivatives arising from commitments to lend are measured using the
same model, based on proxy notional amounts.
Using reasonably possible alternative assumptions for expected cash
flows to value these assets of £2.0 billion would reduce the fair value by
up to £32 million or increase the fair value by up to £45 million. The
assumptions to determine these amounts were based on restructuring
scenarios and expected margins.
Debt securities
Residential mortgage backed securities (RMBS)
RMBS where the underlying assets are US agency-backed mortgages
and there is regular trading are generally classified as level 2 in the fair
value hierarchy. RMBS are also classified as level 2 when regular
trading is not prevalent in the market, but similar executed trades or
third-party data including indices, broker quotes and pricing services
can be used to substantiate the fair value. RMBS are classified as level
3 when trading activity is not available and a model is utilised which
uses significant unobservable data.
In determining whether an instrument is similar to that being valued, the
Group considers a range of factors, principally: the lending standards
of the brokers and underwriters that originated the mortgages, the lead
manager of the security, the issue date of the respective securities, the
underlying asset composition (including origination date, loan to value
ratios, historic loss information and geographic location of the
mortgages), the credit rating of the instrument, and any credit
protection that the instrument may benefit from, such as insurance
wraps or subordinated tranches. Where there are instances of market
observable data for several similar RMBS tranches, the Group considers
the extent of similar characteristics shared with the instrument being
valued, together with the frequency,