RBS 2008 Annual Report Download - page 291
Download and view the complete annual report
Please find page 291 of the 2008 RBS annual report below. You can navigate through the pages in the report by either clicking on the pages listed below, or by using the keyword search tool below to find specific information within the annual report.-
 1
1 -
2
-
3
-
4
-
5
-
6
-
7
-
8
-
9
-
10
-
11
-
12
-
13
-
14
-
15
-
16
-
17
-
18
-
19
-
20
-
21
-
22
-
23
-
24
-
25
-
26
-
27
-
28
-
29
-
30
-
31
-
32
-
33
-
34
-
35
-
36
-
37
-
38
-
39
-
40
-
41
-
42
-
43
-
44
-
45
-
46
-
47
-
48
-
49
-
50
-
51
-
52
-
53
-
54
-
55
-
56
-
57
-
58
-
59
-
60
-
61
-
62
-
63
-
64
-
65
-
66
-
67
-
68
-
69
-
70
-
71
-
72
-
73
-
74
-
75
-
76
-
77
-
78
-
79
-
80
-
81
-
82
-
83
-
84
-
85
-
86
-
87
-
88
-
89
-
90
-
91
-
92
-
93
-
94
-
95
-
96
-
97
-
98
-
99
-
100
-
101
-
102
-
103
-
104
-
105
-
106
-
107
-
108
-
109
-
110
-
111
-
112
-
113
-
114
-
115
-
116
-
117
-
118
-
119
-
120
-
121
-
122
-
123
-
124
-
125
-
126
-
127
-
128
-
129
-
130
-
131
-
132
-
133
-
134
-
135
-
136
-
137
-
138
-
139
-
140
-
141
-
142
-
143
-
144
-
145
-
146
-
147
-
148
-
149
-
150
-
151
-
152
-
153
-
154
-
155
-
156
-
157
-
158
-
159
-
160
-
161
-
162
-
163
-
164
-
165
-
166
-
167
-
168
-
169
-
170
-
171
-
172
-
173
-
174
-
175
-
176
-
177
-
178
-
179
-
180
-
181
-
182
-
183
-
184
-
185
-
186
-
187
-
188
-
189
-
190
-
191
-
192
-
193
-
194
-
195
-
196
-
197
-
198
-
199
-
200
-
201
-
202
-
203
-
204
-
205
-
206
-
207
-
208
-
209
-
210
-
211
-
212
-
213
-
214
-
215
-
216
-
217
-
218
-
219
-
220
-
221
-
222
-
223
-
224
-
225
-
226
-
227
-
228
-
229
-
230
-
231
-
232
-
233
-
234
-
235
-
236
-
237
-
238
-
239
-
240
-
241
-
242
-
243
-
244
-
245
-
246
-
247
-
248
-
249
-
250
-
251
-
252
-
253
-
254
-
255
-
256
-
257
-
258
-
259
-
260
-
261
-
262
-
263
-
264
-
265
-
266
-
267
-
268
-
269
-
270
-
271
-
272
-
273
-
274
-
275
-
276
-
277
-
278
-
279
-
280
-
 281
281 -
 282
282 -
 283
283 -
 284
284 -
 285
285 -
 286
286 -
 287
287 -
 288
288 -
 289
289 -
 290
290 -
 291
291 -
 292
292 -
 293
293 -
 294
294 -
 295
295 -
 296
296 -
 297
297 -
 298
298 -
 299
299
 |
 |

RBS Group Annual Report and Accounts 2008290
Shareholder information continued
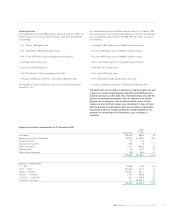
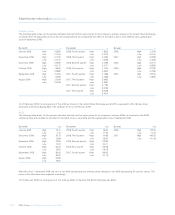
On 24 February 2009, the closing price of the ordinary shares on the London Stock Exchange was £0.2210, equivalent to $0.3184 per share
translated at the Noon Buying Rate of $1.4408 per £1.00 on 24 February 2009.
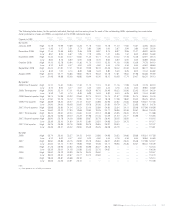
ADSs
The following table shows, for the periods indicated, the high and low sales prices for the company’s ordinary ADSs, as reported on the NYSE
composite tape and restated for the effect of the rights issue in June 2008 and the capitalisation issue in September 2008.
With effect from 7 November 2008, the ratio of one ADS representing one ordinary share changed to one ADS representing 20 ordinary shares. The
prices in the table have been adjusted accordingly.
On 24 February 2009, the closing price of the ordinary ADSs on the New York Stock Exchange was $6.83.
Ordinary shares
The following table shows, for the periods indicated, the high and low sales prices for the company’s ordinary shares on the London Stock Exchange,
as derived from the Daily Official List of the UK Listing Authority and restated for the effect of the rights issue in June 2008 and the capitalisation
issue in September 2008.
By month £
January 2009 High 0.5500
Low 0.1030
December 2008 High 0.7010
Low 0.4140
November 2008 High 0.6900
Low 0.4170
October 2008 High 1.8620
Low 0.5680
September 2008 High 2.4293
Low 1.6180
August 2008 High 2.4293
Low 2.0439
By quarter £
2008: Fourth quarter High 1.8620
Low 0.4140
2008: Third quarter High 2.4293
Low 1.6098
2008: Second quarter High 3.2156
Low 2.0707
2008: First quarter High 3.7054
Low 2.5540
2007: Fourth quarter High 4.7689
Low 3.3265
2007: Third quarter High 5.3802
Low 4.2581
2007: Second quarter High 5.7780
Low 5.2169
2007: First quarter High 6.0208
Low 5.4514
By year £
2008 High 3.7054
Low 0.4140
2007 High 6.0208
Low 3.3265
2006 High 5.5770
Low 4.6559
2005 High 5.1081
Low 4.2456
2004 High 4.9155
Low 4.0865
By month US$
January 2009 High 16.70
Low 3.33
December 2008 High 20.75
Low 12.66
November 2008 High 22.80
Low 12.20
October 2008 High 66.00
Low 18.00
September 2008 High 86.05
Low 55.00
August 2008 High 93.85
Low 78.63
By quarter US$
2008: Fourth quarter High 66.00
Low 12.20
2008: Third quarter High 93.85
Low 55.00
2008: Second quarter High 129.96
Low 83.71
2008: First quarter High 149.05
Low 105.18
2007: Fourth quarter High 189.25
Low 141.18
By year US$
2008 High 149.05
Low 12.20
2007 High 189.25
Low 141.18