RBS 2008 Annual Report Download - page 256
Download and view the complete annual report
Please find page 256 of the 2008 RBS annual report below. You can navigate through the pages in the report by either clicking on the pages listed below, or by using the keyword search tool below to find specific information within the annual report.-
 1
1 -
2
-
3
-
4
-
5
-
6
-
7
-
8
-
9
-
10
-
11
-
12
-
13
-
14
-
15
-
16
-
17
-
18
-
19
-
20
-
21
-
22
-
23
-
24
-
25
-
26
-
27
-
28
-
29
-
30
-
31
-
32
-
33
-
34
-
35
-
36
-
37
-
38
-
39
-
40
-
41
-
42
-
43
-
44
-
45
-
46
-
47
-
48
-
49
-
50
-
51
-
52
-
53
-
54
-
55
-
56
-
57
-
58
-
59
-
60
-
61
-
62
-
63
-
64
-
65
-
66
-
67
-
68
-
69
-
70
-
71
-
72
-
73
-
74
-
75
-
76
-
77
-
78
-
79
-
80
-
81
-
82
-
83
-
84
-
85
-
86
-
87
-
88
-
89
-
90
-
91
-
92
-
93
-
94
-
95
-
96
-
97
-
98
-
99
-
100
-
101
-
102
-
103
-
104
-
105
-
106
-
107
-
108
-
109
-
110
-
111
-
112
-
113
-
114
-
115
-
116
-
117
-
118
-
119
-
120
-
121
-
122
-
123
-
124
-
125
-
126
-
127
-
128
-
129
-
130
-
131
-
132
-
133
-
134
-
135
-
136
-
137
-
138
-
139
-
140
-
141
-
142
-
143
-
144
-
145
-
146
-
147
-
148
-
149
-
150
-
151
-
152
-
153
-
154
-
155
-
156
-
157
-
158
-
159
-
160
-
161
-
162
-
163
-
164
-
165
-
166
-
167
-
168
-
169
-
170
-
171
-
172
-
173
-
174
-
175
-
176
-
177
-
178
-
179
-
180
-
181
-
182
-
183
-
184
-
185
-
186
-
187
-
188
-
189
-
190
-
191
-
192
-
193
-
194
-
195
-
196
-
197
-
198
-
199
-
200
-
201
-
202
-
203
-
204
-
205
-
206
-
207
-
208
-
209
-
210
-
211
-
212
-
213
-
214
-
215
-
216
-
217
-
218
-
219
-
220
-
221
-
222
-
223
-
224
-
225
-
226
-
227
-
228
-
229
-
230
-
231
-
232
-
233
-
234
-
235
-
236
-
237
-
238
-
239
-
240
-
241
-
242
-
243
-
244
-
245
-
 246
246 -
 247
247 -
 248
248 -
 249
249 -
 250
250 -
 251
251 -
 252
252 -
 253
253 -
 254
254 -
 255
255 -
 256
256 -
 257
257 -
 258
258 -
 259
259 -
 260
260 -
 261
261 -
 262
262 -
 263
263 -
 264
264 -
 265
265 -
 266
266 -
267
-
268
-
269
-
270
-
271
-
272
-
273
-
274
-
275
-
276
-
277
-
278
-
279
-
280
-
281
-
282
-
283
-
284
-
285
-
286
-
287
-
288
-
289
-
290
-
291
-
292
-
293
-
294
-
295
-
296
-
297
-
298
-
299
 |
 |

255RBS Group Annual Report and Accounts 2008
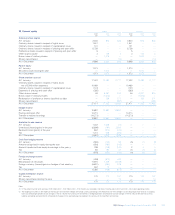
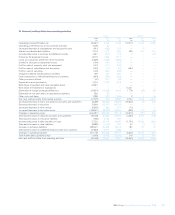
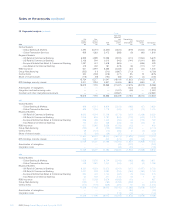
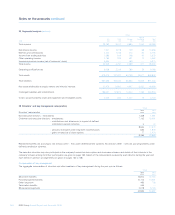
33 Net cash (outflow)/inflow from operating activities
Group Company
2008 2007 2006 2008 2007 2006
£m £m £m £m £m £m
Operating (loss)/profit before tax (40,667) 9,832 9,186 (10,017) 2,372 3,486
Operating profit before tax on discontinued activities 4,208 68 — ———
(Increase)/decrease in prepayments and accrued income (921) (662) 322 —(1) —
Interest on subordinated liabilities 2,144 1,518 1,386 499 470 520
Increase/(decrease) in accruals and deferred income 3,961 (818) 515 7— (27)
Provisions for impairment losses 8,072 1,968 1,877 ———
Loans and advances written-off net of recoveries (2,829) (1,669) (1,626) ———
Unwind of discount on impairment losses (194) (164) (142) ———
Profit on sale of property, plant and equipment (167) (741) (216) ———
Profit on sale of subsidiaries and associates (943) (67) (44) (487) ——
Profit on sale of securities (342) (544) (369) ———
Charge for defined benefit pension schemes 490 489 580 ———
Cash contribution to defined benefit pension schemes (810) (599) (536) ———
Other provisions utilised (32) (211) (42) ———
Depreciation and amortisation 3,154 1,932 1,678 ———
Write down of goodwill and other intangible assets 32,581 —————
Write down of investment in subsidiaries — ——14,321 ——
Elimination of foreign exchange differences (41,874) (10,282) 4,516 1,778 (58) (22)
Elimination of non-cash items on discontinued activities 592 62 — ———
Other non-cash items 1,998 (327) (1,395) 22 45
Net cash (outflow)/inflow from trading activities (31,579) (215) 15,690 6,103 2,785 4,002
(Increase)/decrease in loans and advances to banks and customers (5,469) (90,829) (44,525) (15,542) (8) 346
Decrease/(increase) in securities 75,964 (26,167) (16,703) ———
(Increase)/decrease in other assets (5,845) (384) 671 (73) —2
(Increase)/decrease in derivative assets (708,607) (88,948) (18,616) (995) (173) 55
Changes in operating assets (643,957) (206,328) (79,173) (16,610) (181) 403
(Decrease)/increase in deposits by banks and customers (78,166) 81,645 63,091 (4,064) 4,677 (164)
(Decrease)/increase in insurance liabilities (186) 2,706 244 ———
Increase/(decrease) in debt securities in issue 27,222 59,735 (4,457) (1,794) 10,936 (803)
(Decrease)/increase in other liabilities (8,869) (1,036) 935 32 (7) 14
Increase in derivative liabilities 699,601 83,466 19,272 182 137 42
(Decrease)/increase in settlement balances and short positions (37,864) 8,073 4,068 ———
Changes in operating liabilities 601,738 234,589 83,153 (5,644) 15,743 (911)
Total income taxes (paid)/received (1,540) (2,442) (2,229) 119 6 154
Net cash (outflow)/inflow from operating activities (75,338) 25,604 17,441 (16,032) 18,353 3,648