RBS 2008 Annual Report Download - page 178
Download and view the complete annual report
Please find page 178 of the 2008 RBS annual report below. You can navigate through the pages in the report by either clicking on the pages listed below, or by using the keyword search tool below to find specific information within the annual report.-
 1
1 -
2
-
3
-
4
-
5
-
6
-
7
-
8
-
9
-
10
-
11
-
12
-
13
-
14
-
15
-
16
-
17
-
18
-
19
-
20
-
21
-
22
-
23
-
24
-
25
-
26
-
27
-
28
-
29
-
30
-
31
-
32
-
33
-
34
-
35
-
36
-
37
-
38
-
39
-
40
-
41
-
42
-
43
-
44
-
45
-
46
-
47
-
48
-
49
-
50
-
51
-
52
-
53
-
54
-
55
-
56
-
57
-
58
-
59
-
60
-
61
-
62
-
63
-
64
-
65
-
66
-
67
-
68
-
69
-
70
-
71
-
72
-
73
-
74
-
75
-
76
-
77
-
78
-
79
-
80
-
81
-
82
-
83
-
84
-
85
-
86
-
87
-
88
-
89
-
90
-
91
-
92
-
93
-
94
-
95
-
96
-
97
-
98
-
99
-
100
-
101
-
102
-
103
-
104
-
105
-
106
-
107
-
108
-
109
-
110
-
111
-
112
-
113
-
114
-
115
-
116
-
117
-
118
-
119
-
120
-
121
-
122
-
123
-
124
-
125
-
126
-
127
-
128
-
129
-
130
-
131
-
132
-
133
-
134
-
135
-
136
-
137
-
138
-
139
-
140
-
141
-
142
-
143
-
144
-
145
-
146
-
147
-
148
-
149
-
150
-
151
-
152
-
153
-
154
-
155
-
156
-
157
-
158
-
159
-
160
-
161
-
162
-
163
-
164
-
165
-
166
-
167
-
 168
168 -
 169
169 -
 170
170 -
 171
171 -
 172
172 -
 173
173 -
 174
174 -
 175
175 -
 176
176 -
 177
177 -
 178
178 -
 179
179 -
 180
180 -
 181
181 -
 182
182 -
 183
183 -
 184
184 -
 185
185 -
 186
186 -
 187
187 -
 188
188 -
189
-
190
-
191
-
192
-
193
-
194
-
195
-
196
-
197
-
198
-
199
-
200
-
201
-
202
-
203
-
204
-
205
-
206
-
207
-
208
-
209
-
210
-
211
-
212
-
213
-
214
-
215
-
216
-
217
-
218
-
219
-
220
-
221
-
222
-
223
-
224
-
225
-
226
-
227
-
228
-
229
-
230
-
231
-
232
-
233
-
234
-
235
-
236
-
237
-
238
-
239
-
240
-
241
-
242
-
243
-
244
-
245
-
246
-
247
-
248
-
249
-
250
-
251
-
252
-
253
-
254
-
255
-
256
-
257
-
258
-
259
-
260
-
261
-
262
-
263
-
264
-
265
-
266
-
267
-
268
-
269
-
270
-
271
-
272
-
273
-
274
-
275
-
276
-
277
-
278
-
279
-
280
-
281
-
282
-
283
-
284
-
285
-
286
-
287
-
288
-
289
-
290
-
291
-
292
-
293
-
294
-
295
-
296
-
297
-
298
-
299
 |
 |

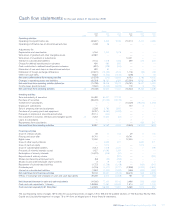
Cash flow statements for the year ended 31 December 2008
177RBS Group Annual Report and Accounts 2008
Group Company
2008 2007 2006 2008 2007 2006
Note £m £m £m £m £m £m
Operating activities
Operating (loss)/profit before tax (40,667) 9,832 9,186 (10,017) 2,372 3,486
Operating profit before tax on discontinued activities 4,208 68 — ———
Adjustments for:
Depreciation and amortisation 3,154 1,932 1,678 ———
Write-down of goodwill and other intangible assets 32,581 —————
Write-down of investment in subsidiaries 14,321 ——
Interest on subordinated liabilities 2,144 1,518 1,386 499 470 520
Charge for defined benefit pension schemes 490 489 580 ———
Cash contribution to defined benefit pension schemes (810) (599) (536) ———
Elimination of non-cash items on discontinued activities 592 62 — ———
Elimination of foreign exchange differences (41,874) (10,282) 4,516 1,778 (58) (22)
Other non-cash items 8,603 (3,235) (1,120) (478) 1 18
Net cash (outflow)/inflow from trading activities (31,579) (215) 15,690 6,103 2,785 4,002
Changes in operating assets and liabilities (42,219) 28,261 3,980 (22,254) 15,562 (508)
Net cash flows from operating activities before tax (73,798) 28,046 19,670 (16,151) 18,347 3,494
Income taxes (paid)/received (1,540) (2,442) (2,229) 119 6 154
Net cash flows from operating activities 33 (75,338) 25,604 17,441 (16,032) 18,353 3,648
Investing activities
Sale and maturity of securities 53,390 63,007 27,126 ———
Purchase of securities (55,229) (61,020) (19,126) ———
Investment in subsidiaries — ——(10,349) (18,510) (1,097)
Disposal of subsidiaries — ——700 6—
Sale of property, plant and equipment 2,228 5,786 2,990 ———
Purchase of property, plant and equipment (5,757) (5,080) (4,282) ———
Proceeds on disposal of discontinued activities 20,113 (334) — ———
Net investment in business interests and intangible assets 34 2,252 13,640 (63) ———
Loans to subsidiaries — —————
Repayments from subsidiaries — ———469 547
Net cash flows from investing activities 16,997 15,999 6,645 (9,649) (18,035) (550)
Financing activities
Issue of ordinary shares 49 77 104 49 77 104
Placing and open offer 19,741 ——19,741 ——
Rights issue 12,000 ——12,000 ——
Issue of other equity interests — 3,600 671 3,600 671
Issue of paid up equity — 1,073 — —1,073 —
Issue of subordinated liabilities 2,413 1,018 3,027 —— 399
Proceeds of minority interests issued 1,427 31,095 1,354 ———
Redemption of minority interests (13,579) (545) (81) ———
Repurchase of ordinary shares — — (991) —— (991)
Shares purchased by employee trusts (64) (65) (254) ———
Shares issued under employee share schemes 2 79 108 ——7
Repayment of subordinated liabilities (1,727) (1,708) (1,318) —(469) (547)
Dividends paid (3,193) (3,411) (2,727) (2,908) (3,290) (2,661)
Interest on subordinated liabilities (1,967) (1,522) (1,409) (466) (455) (497)
Net cash flows from financing activities 15,102 29,691 (1,516) 28,416 536 (3,515)
Effects of exchange rate changes on cash and cash equivalents 29,209 6,010 (3,468) 761 62 (52)
Net (decrease)/increase in cash and cash equivalents (14,030) 77,304 19,102 3,496 916 (469)
Cash and cash equivalents 1 January 148,955 71,651 52,549 1,573 657 1,126
Cash and cash equivalents 31 December 134,925 148,955 71,651 5,069 1,573 657
The accompanying notes on pages 189 to 266, the accounting policies on pages 178 to 188 and the audited sections of ‘The Business Review: Risk,
Capital and Liquidity Management’ on pages 78 to 144 form an integral part of these financial statements.