RBS 2008 Annual Report Download - page 93
Download and view the complete annual report
Please find page 93 of the 2008 RBS annual report below. You can navigate through the pages in the report by either clicking on the pages listed below, or by using the keyword search tool below to find specific information within the annual report.-
 1
1 -
2
-
3
-
4
-
5
-
6
-
7
-
8
-
9
-
10
-
11
-
12
-
13
-
14
-
15
-
16
-
17
-
18
-
19
-
20
-
21
-
22
-
23
-
24
-
25
-
26
-
27
-
28
-
29
-
30
-
31
-
32
-
33
-
34
-
35
-
36
-
37
-
38
-
39
-
40
-
41
-
42
-
43
-
44
-
45
-
46
-
47
-
48
-
49
-
50
-
51
-
52
-
53
-
54
-
55
-
56
-
57
-
58
-
59
-
60
-
61
-
62
-
63
-
64
-
65
-
66
-
67
-
68
-
69
-
70
-
71
-
72
-
73
-
74
-
75
-
76
-
77
-
78
-
79
-
80
-
81
-
82
-
 83
83 -
 84
84 -
 85
85 -
 86
86 -
 87
87 -
 88
88 -
 89
89 -
 90
90 -
 91
91 -
 92
92 -
 93
93 -
 94
94 -
 95
95 -
 96
96 -
 97
97 -
 98
98 -
 99
99 -
 100
100 -
 101
101 -
 102
102 -
 103
103 -
104
-
105
-
106
-
107
-
108
-
109
-
110
-
111
-
112
-
113
-
114
-
115
-
116
-
117
-
118
-
119
-
120
-
121
-
122
-
123
-
124
-
125
-
126
-
127
-
128
-
129
-
130
-
131
-
132
-
133
-
134
-
135
-
136
-
137
-
138
-
139
-
140
-
141
-
142
-
143
-
144
-
145
-
146
-
147
-
148
-
149
-
150
-
151
-
152
-
153
-
154
-
155
-
156
-
157
-
158
-
159
-
160
-
161
-
162
-
163
-
164
-
165
-
166
-
167
-
168
-
169
-
170
-
171
-
172
-
173
-
174
-
175
-
176
-
177
-
178
-
179
-
180
-
181
-
182
-
183
-
184
-
185
-
186
-
187
-
188
-
189
-
190
-
191
-
192
-
193
-
194
-
195
-
196
-
197
-
198
-
199
-
200
-
201
-
202
-
203
-
204
-
205
-
206
-
207
-
208
-
209
-
210
-
211
-
212
-
213
-
214
-
215
-
216
-
217
-
218
-
219
-
220
-
221
-
222
-
223
-
224
-
225
-
226
-
227
-
228
-
229
-
230
-
231
-
232
-
233
-
234
-
235
-
236
-
237
-
238
-
239
-
240
-
241
-
242
-
243
-
244
-
245
-
246
-
247
-
248
-
249
-
250
-
251
-
252
-
253
-
254
-
255
-
256
-
257
-
258
-
259
-
260
-
261
-
262
-
263
-
264
-
265
-
266
-
267
-
268
-
269
-
270
-
271
-
272
-
273
-
274
-
275
-
276
-
277
-
278
-
279
-
280
-
281
-
282
-
283
-
284
-
285
-
286
-
287
-
288
-
289
-
290
-
291
-
292
-
293
-
294
-
295
-
296
-
297
-
298
-
299
 |
 |

92
Business review continued
RBS Group Annual Report and Accounts 2008
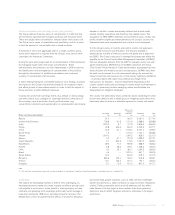
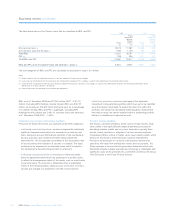
UK residential mortgages
The UK mortgage portfolio totalled £74.4 billion (as at 31 December
2008) an increase of 11% during the year due to strong sales growth
and lower redemption rates. The main brands are the Royal Bank,
NatWest, the One Account, First Active and Direct Line. The assets
comprise prime mortgage lending and include 7.0% (£5.2 billion) of
exposure to residential buy-to-let. There is a very small legacy self-
certification book (0.5% of total assets) which was withdrawn from sale
in 2004.
The Group exited the 100% LTV market in the first quarter of 2008,
further restricted the proportion of highest LTV loans and reviewed
affordability criteria during the year. The average LTV for new business
increased from 62% to 67% in 2008 mainly due to a reduction in the
proportion of business within the lowest LTV bands.
The arrears rate (three or more payments missed) on the combined
Royal Bank and NatWest brands was 1.5% (31 December 2008) up
from 1.0% (31 December 2007). The mortgage impairment charge was
£33 million for 2008 (2007 – £19 million) and in current economic
conditions is expected to increase further. Anticipated losses from
impaired mortgages are covered by a combination of impairment
provisions and post default suspended interest. The combined provision
cover is currently 0.18% of balances.
Repossessions totalled 1,141 in 2008 (compared with 758 in 2007) with
similar volumes in each half of the year.
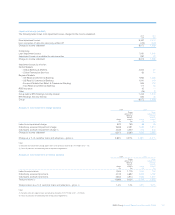
US real estate
Citizens Financial Group’s (CFG) residential real estate portfolio totalled
$50.1 billion at 31 December 2008 (2007 – $53.1 billion) comprising
$13.8 billion of first mortgages and $36.3 billion of Home Equity loans
and lines. This reduction includes the sale of $1.4 billion of real estate
assets to the Federal National Mortgage Association in December 2008.
CFG has historically adopted conservative risk policies in comparison to
the general market. Small exposures to sub-prime (FICO <=620,
approximately 0.6%) and Alt-A / other non-conforming (4.5%) from past
bank acquisitions are in run-off. The average indexed LTV was 69% as at
31 December 2008 (2007 – 62%). Loan acceptance criteria were further
tightened during 2008 to address deteriorating economic conditions.
The Serviced By Others (SBO) portfolio consists of purchased pools of
home equity loans and lines whose LTV and geographic profiles have in
the current economic conditions resulted in a higher write-off rate of
4.8% in 2008 than core portfolios. SBO was closed to new purchases in
the third quarter of 2007 and is in run-off with exposure down from $8.3
billion (31 December 2007) to $7.0 billion (31 December 2008).
Ireland residential mortgages
The residential mortgage portfolio in Ireland across the Ulster Bank and
First Active brands totalled £24.6 billion (as at 31 December 2008) with
92.8% in the Republic of Ireland and 7.2% in Northern Ireland. This
represents growth of 6% in the Republic of Ireland (ignoring exchange
rate movements) and 6% in Northern Ireland. During the course of
2008, Ulster Bank exited the 100% LTV market and tightened LTV and
affordability criteria in other segments. The arrears rate (three or more
payments missed) increased to 1.6% at 31 December 2008 from 0.8%
at end 2007 driven by deteriorating economic conditions. Repossession
remained low and totalled 37 for 2008.
Financial institutions
The confidence and liquidity crisis affecting the banking sector saw the
near collapse of some major banks in Western countries along with the
fall of Lehman Brothers and the Icelandic banking system, which in turn
threatened the stability of national and global banking systems.
Government actions to restore stability by providing guarantees, liquidity
facilities, capital injections and facilitating the consolidation of weaker banks
with stronger ones met with some success. There remains a high level
of risk in the banking sector in 2009, particularly due to the deepening
recession that many countries face and increasing corporate defaults.
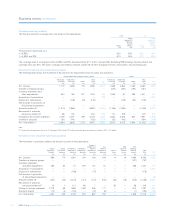
Financial Institutions constitute the largest segment of the Group’s
wholesale credit portfolio with exposure of £181 billion. Due to
difficulties faced by the sector, the portfolio quality has weakened
during 2008. 92% of exposure is to counterparties in developed OECD
countries while 90% of exposure is to investment grade counterparties.
The Banks portfolio is the biggest sub-sector with exposure of £86
billion. At the time of default, the Group’s exposures to Lehman Brothers
and the Icelandic banks totalled £802 million and £494 million
respectively and represented less than 1% of the total Banks portfolio.
2008 was a difficult year for the hedge funds sector. More hedge funds
collapsed during 2008 than in the previous ten years and the values of
many declined significantly. The spate of redemptions from investors
forced major hedge fund groups to halt withdrawals. The trends are set
to continue in 2009 and the contraction of this sector is expected.
The Group’s exposure to leveraged funds (including hedge funds)
totalled £10.3 billion. The majority of hedge funds are domiciled in the
UK and US but the portfolio is diversified by fund strategy. The Group’s
activities with hedge funds are primarily collateralised derivatives
trading. Exposures to funds encountering problems were reduced,
collateral margining was reviewed upwards to further mitigate risk and
the appropriateness of limits is regularly reviewed.
During 2009, the Group will continue to place emphasis on the pro-
active management of financial institutions at counterparty and portfolio
levels, recognising that liquidity is likely to remain tight and credit quality
is likely to deteriorate further across a range of portfolios.