RBS 2008 Annual Report Download - page 212
Download and view the complete annual report
Please find page 212 of the 2008 RBS annual report below. You can navigate through the pages in the report by either clicking on the pages listed below, or by using the keyword search tool below to find specific information within the annual report.-
 1
1 -
2
-
3
-
4
-
5
-
6
-
7
-
8
-
9
-
10
-
11
-
12
-
13
-
14
-
15
-
16
-
17
-
18
-
19
-
20
-
21
-
22
-
23
-
24
-
25
-
26
-
27
-
28
-
29
-
30
-
31
-
32
-
33
-
34
-
35
-
36
-
37
-
38
-
39
-
40
-
41
-
42
-
43
-
44
-
45
-
46
-
47
-
48
-
49
-
50
-
51
-
52
-
53
-
54
-
55
-
56
-
57
-
58
-
59
-
60
-
61
-
62
-
63
-
64
-
65
-
66
-
67
-
68
-
69
-
70
-
71
-
72
-
73
-
74
-
75
-
76
-
77
-
78
-
79
-
80
-
81
-
82
-
83
-
84
-
85
-
86
-
87
-
88
-
89
-
90
-
91
-
92
-
93
-
94
-
95
-
96
-
97
-
98
-
99
-
100
-
101
-
102
-
103
-
104
-
105
-
106
-
107
-
108
-
109
-
110
-
111
-
112
-
113
-
114
-
115
-
116
-
117
-
118
-
119
-
120
-
121
-
122
-
123
-
124
-
125
-
126
-
127
-
128
-
129
-
130
-
131
-
132
-
133
-
134
-
135
-
136
-
137
-
138
-
139
-
140
-
141
-
142
-
143
-
144
-
145
-
146
-
147
-
148
-
149
-
150
-
151
-
152
-
153
-
154
-
155
-
156
-
157
-
158
-
159
-
160
-
161
-
162
-
163
-
164
-
165
-
166
-
167
-
168
-
169
-
170
-
171
-
172
-
173
-
174
-
175
-
176
-
177
-
178
-
179
-
180
-
181
-
182
-
183
-
184
-
185
-
186
-
187
-
188
-
189
-
190
-
191
-
192
-
193
-
194
-
195
-
196
-
197
-
198
-
199
-
200
-
201
-
 202
202 -
 203
203 -
 204
204 -
 205
205 -
 206
206 -
 207
207 -
 208
208 -
 209
209 -
 210
210 -
 211
211 -
 212
212 -
 213
213 -
 214
214 -
 215
215 -
 216
216 -
 217
217 -
 218
218 -
 219
219 -
 220
220 -
 221
221 -
 222
222 -
223
-
224
-
225
-
226
-
227
-
228
-
229
-
230
-
231
-
232
-
233
-
234
-
235
-
236
-
237
-
238
-
239
-
240
-
241
-
242
-
243
-
244
-
245
-
246
-
247
-
248
-
249
-
250
-
251
-
252
-
253
-
254
-
255
-
256
-
257
-
258
-
259
-
260
-
261
-
262
-
263
-
264
-
265
-
266
-
267
-
268
-
269
-
270
-
271
-
272
-
273
-
274
-
275
-
276
-
277
-
278
-
279
-
280
-
281
-
282
-
283
-
284
-
285
-
286
-
287
-
288
-
289
-
290
-
291
-
292
-
293
-
294
-
295
-
296
-
297
-
298
-
299
 |
 |

211RBS Group Annual Report and Accounts 2008
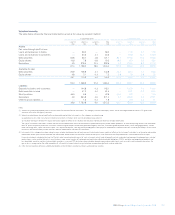
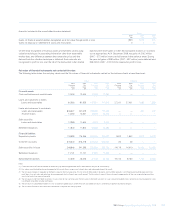
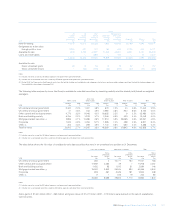
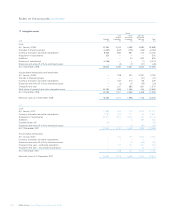
The following tables show the contractual undiscounted cash flows payable up to a period of twenty years including future payments of interest.
On balance sheet liabilities
Group
0-3 months 3-12 months 1-3 years 3-5 years 5-10 years 10-20 years
2008 £m £m £m £m £m £m
Deposits by banks 154,614 14,347 3,345 2,754 2,048 34
Customer accounts 523,268 33,450 6,577 6,337 7,298 5,319
Debt securities in issue 131,714 48,652 40,067 38,223 38,667 5,626
Derivatives held for hedging 394 2,216 2,543 1,334 2,682 1,373
Subordinated liabilities 1,753 4,271 6,824 5,793 24,503 13,030
Settlement balances and other liabilities 13,351 5 12 6 10 6
825,094 102,941 59,368 54,447 75,208 25,388
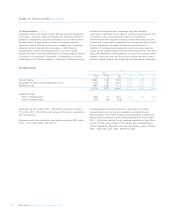
2007
Deposits by banks 220,914 21,580 3,206 2,225 1,509 434
Customer accounts 561,003 30,539 9,430 4,509 11,615 9,052
Debt securities in issue 111,292 37,292 57,562 34,917 44,166 4,223
Derivatives held for hedging 252 667 822 449 605 118
Subordinated liabilities 641 3,720 5,603 3,466 22,735 6,354
Settlement balances and other liabilities 17,998 5 14 6 12 7
912,100 93,803 76,637 45,572 80,642 20,188
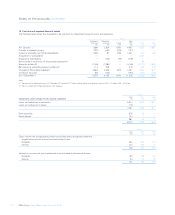
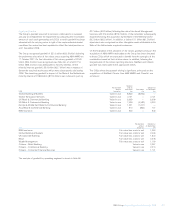
Company
0-3 months 3-12 months 1-3 years 3-5 years 5-10 years 10-20 years
2008 £m £m £m £m £m £m
Deposits by banks 116 1,707 ————
Debt securities in issue 4,448 3,105 1,334 6,105 ——
Derivatives held for hedging 186 16 30 1——
Subordinated liabilities 158 458 1,464 1,376 4,241 5,149
4,908 5,286 2,828 7,482 4,241 5,149
2007
Deposits by banks 116 5,544 ————
Debt securities in issue 824 8,477 3,447 1,372 ——
Derivatives held for hedging 52 1— 2——
Subordinated liabilities 116 347 1,119 1,045 3,282 3,909
1,108 14,369 4,566 2,419 3,282 3,909
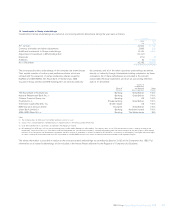
The tables above show the timing of cash outflows to settle financial
liabilities. They have been prepared on the following basis:
Financial liabilities are included at the earliest date on which the
counterparty can require repayment regardless of whether or not such
early repayment results in a penalty. If repayment is triggered by, or is
subject to, specific criteria such as market price hurdles being reached,
the liability is included at the earliest possible date that the conditions
could be fulfilled without considering the probability of the conditions
being met. For example, if a structured note is automatically prepaid
when an equity index exceeds a certain level, the cash outflow will be
included in the less than three months period whatever the level of the
index at the year end. The settlement date of debt securities in issue
issued by certain securitisation vehicles consolidated by the Group
depends on when cash flows are received from the securitised assets.
Where these assets are prepayable, the timing of the cash outflow
relating to securities assumes that each asset will be prepaid at the
earliest possible date.
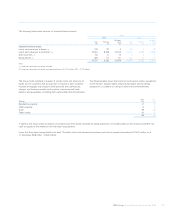
Liabilities with a contractual maturity of greater than 20 years – the
principal amounts of financial liabilities that are repayable after 20 years
or where the counterparty has no right to repayment of the principal are
excluded from the table as are interest payments after 20 years.
Held-for-trading liabilities – held-for-trading liabilities amounting to
£1,146.7 billion (liabilities) (2007 – £478.6 billion) have been excluded
from the table in view of their short term nature.