RBS 2008 Annual Report Download - page 224
Download and view the complete annual report
Please find page 224 of the 2008 RBS annual report below. You can navigate through the pages in the report by either clicking on the pages listed below, or by using the keyword search tool below to find specific information within the annual report.-
 1
1 -
2
-
3
-
4
-
5
-
6
-
7
-
8
-
9
-
10
-
11
-
12
-
13
-
14
-
15
-
16
-
17
-
18
-
19
-
20
-
21
-
22
-
23
-
24
-
25
-
26
-
27
-
28
-
29
-
30
-
31
-
32
-
33
-
34
-
35
-
36
-
37
-
38
-
39
-
40
-
41
-
42
-
43
-
44
-
45
-
46
-
47
-
48
-
49
-
50
-
51
-
52
-
53
-
54
-
55
-
56
-
57
-
58
-
59
-
60
-
61
-
62
-
63
-
64
-
65
-
66
-
67
-
68
-
69
-
70
-
71
-
72
-
73
-
74
-
75
-
76
-
77
-
78
-
79
-
80
-
81
-
82
-
83
-
84
-
85
-
86
-
87
-
88
-
89
-
90
-
91
-
92
-
93
-
94
-
95
-
96
-
97
-
98
-
99
-
100
-
101
-
102
-
103
-
104
-
105
-
106
-
107
-
108
-
109
-
110
-
111
-
112
-
113
-
114
-
115
-
116
-
117
-
118
-
119
-
120
-
121
-
122
-
123
-
124
-
125
-
126
-
127
-
128
-
129
-
130
-
131
-
132
-
133
-
134
-
135
-
136
-
137
-
138
-
139
-
140
-
141
-
142
-
143
-
144
-
145
-
146
-
147
-
148
-
149
-
150
-
151
-
152
-
153
-
154
-
155
-
156
-
157
-
158
-
159
-
160
-
161
-
162
-
163
-
164
-
165
-
166
-
167
-
168
-
169
-
170
-
171
-
172
-
173
-
174
-
175
-
176
-
177
-
178
-
179
-
180
-
181
-
182
-
183
-
184
-
185
-
186
-
187
-
188
-
189
-
190
-
191
-
192
-
193
-
194
-
195
-
196
-
197
-
198
-
199
-
200
-
201
-
202
-
203
-
204
-
205
-
206
-
207
-
208
-
209
-
210
-
211
-
212
-
213
-
 214
214 -
 215
215 -
 216
216 -
 217
217 -
 218
218 -
 219
219 -
 220
220 -
 221
221 -
 222
222 -
 223
223 -
 224
224 -
 225
225 -
 226
226 -
 227
227 -
 228
228 -
 229
229 -
 230
230 -
 231
231 -
 232
232 -
 233
233 -
 234
234 -
235
-
236
-
237
-
238
-
239
-
240
-
241
-
242
-
243
-
244
-
245
-
246
-
247
-
248
-
249
-
250
-
251
-
252
-
253
-
254
-
255
-
256
-
257
-
258
-
259
-
260
-
261
-
262
-
263
-
264
-
265
-
266
-
267
-
268
-
269
-
270
-
271
-
272
-
273
-
274
-
275
-
276
-
277
-
278
-
279
-
280
-
281
-
282
-
283
-
284
-
285
-
286
-
287
-
288
-
289
-
290
-
291
-
292
-
293
-
294
-
295
-
296
-
297
-
298
-
299
 |
 |

223RBS Group Annual Report and Accounts 2008
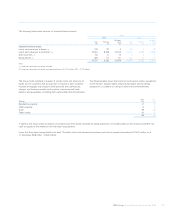
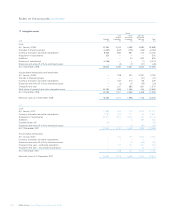
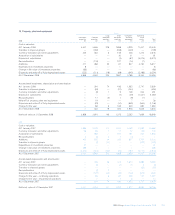
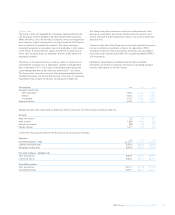
18 Property, plant and equipment
Group
Long Short Computers Operating
Investment Freehold leasehold leasehold and other lease
properties premises premises premises equipment assets Total
2008 £m £m £m £m £m £m £m
Cost or valuation:
At 1 January 2008 3,431 3,645 215 1,688 3,929 11,437 24,345
Transfers to disposal groups — (262) — (188) (349) — (799)
Currency translation and other adjustments 320 452 5 149 436 1,313 2,675
Acquisition of subsidiaries ———30 31 — 61
Disposal of subsidiaries ———(2) (57) (5,015) (5,074)
Reclassifications — (176) — 197 (14) (7) —
Additions 417 486 22 61 837 3,794 5,617
Expenditure on investment properties 8————— 8
Change in fair value of investment properties (86) —————(86)
Disposals and write-off of fully depreciated assets (222) (113) (18) (68) (645) (2,188) (3,254)
At 31 December 2008 3,868 4,032 224 1,867 4,168 9,334 23,493
Accumulated impairment, depreciation and amortisation:
At 1 January 2008 — 391 74 436 1,952 2,747 5,600
Transfers to disposal groups — (60) — (91) (243) — (394)
Currency translation and other adjustments — (9) 19148 202 351
Disposal of subsidiaries ———(1) (39) (1,447) (1,487)
Reclassifications — 17 (2) 1 (9) (7) —
Write-off of property, plant and equipment — 19 —— 7—26
Disposals and write-off of fully depreciated assets — (22) — (31) (539) (544) (1,136)
Charge for the year — 86 6 169 639 684 1,584
At 31 December 2008 — 422 79 492 1,916 1,635 4,544
Net book value at 31 December 2008 3,868 3,610 145 1,375 2,252 7,699 18,949
2007
Cost or valuation:
At 1 January 2007 4,885 2,579 310 1,254 3,069 11,589 23,686
Currency translation and other adjustments 96 65 1 11 12 (10) 175
Acquisition of subsidiaries — 950 — 157 191 202 1,500
Reclassifications 3 (4) 31(3) ——
Additions 450 592 34 309 857 2,791 5,033
Transfers to disposal groups — (4) (13) ——(422) (439)
Expenditure on investment properties 41 —————41
Change in fair value of investment properties 288 —————288
Disposals and write-off of fully depreciated assets (2,332) (533) (120) (44) (197) (2,713) (5,939)
At 31 December 2007 3,431 3,645 215 1,688 3,929 11,437 24,345
Accumulated depreciation and amortisation:
At 1 January 2007 — 446 96 374 1,670 2,680 5,266
Currency translation and other adjustments — (4) — (1) (1) 2 (4)
Transfers to disposal groups —————(52) (52)
Reclassifications — (2) 2————
Disposals and write-off of fully depreciated assets — (122) (32) (25) (132) (610) (921)
Charge for the year – continuing operations — 66 8 87 409 727 1,297
Charge for the year – discontinued operations —7—16—14
At 31 December 2007 — 391 74 436 1,952 2,747 5,600
Net book value at 31 December 2007 3,431 3,254 141 1,252 1,977 8,690 18,745