RBS 2008 Annual Report Download - page 138
Download and view the complete annual report
Please find page 138 of the 2008 RBS annual report below. You can navigate through the pages in the report by either clicking on the pages listed below, or by using the keyword search tool below to find specific information within the annual report.-
 1
1 -
2
-
3
-
4
-
5
-
6
-
7
-
8
-
9
-
10
-
11
-
12
-
13
-
14
-
15
-
16
-
17
-
18
-
19
-
20
-
21
-
22
-
23
-
24
-
25
-
26
-
27
-
28
-
29
-
30
-
31
-
32
-
33
-
34
-
35
-
36
-
37
-
38
-
39
-
40
-
41
-
42
-
43
-
44
-
45
-
46
-
47
-
48
-
49
-
50
-
51
-
52
-
53
-
54
-
55
-
56
-
57
-
58
-
59
-
60
-
61
-
62
-
63
-
64
-
65
-
66
-
67
-
68
-
69
-
70
-
71
-
72
-
73
-
74
-
75
-
76
-
77
-
78
-
79
-
80
-
81
-
82
-
83
-
84
-
85
-
86
-
87
-
88
-
89
-
90
-
91
-
92
-
93
-
94
-
95
-
96
-
97
-
98
-
99
-
100
-
101
-
102
-
103
-
104
-
105
-
106
-
107
-
108
-
109
-
110
-
111
-
112
-
113
-
114
-
115
-
116
-
117
-
118
-
119
-
120
-
121
-
122
-
123
-
124
-
125
-
126
-
127
-
 128
128 -
 129
129 -
 130
130 -
 131
131 -
 132
132 -
 133
133 -
 134
134 -
 135
135 -
 136
136 -
 137
137 -
 138
138 -
 139
139 -
 140
140 -
 141
141 -
 142
142 -
 143
143 -
 144
144 -
 145
145 -
 146
146 -
 147
147 -
 148
148 -
149
-
150
-
151
-
152
-
153
-
154
-
155
-
156
-
157
-
158
-
159
-
160
-
161
-
162
-
163
-
164
-
165
-
166
-
167
-
168
-
169
-
170
-
171
-
172
-
173
-
174
-
175
-
176
-
177
-
178
-
179
-
180
-
181
-
182
-
183
-
184
-
185
-
186
-
187
-
188
-
189
-
190
-
191
-
192
-
193
-
194
-
195
-
196
-
197
-
198
-
199
-
200
-
201
-
202
-
203
-
204
-
205
-
206
-
207
-
208
-
209
-
210
-
211
-
212
-
213
-
214
-
215
-
216
-
217
-
218
-
219
-
220
-
221
-
222
-
223
-
224
-
225
-
226
-
227
-
228
-
229
-
230
-
231
-
232
-
233
-
234
-
235
-
236
-
237
-
238
-
239
-
240
-
241
-
242
-
243
-
244
-
245
-
246
-
247
-
248
-
249
-
250
-
251
-
252
-
253
-
254
-
255
-
256
-
257
-
258
-
259
-
260
-
261
-
262
-
263
-
264
-
265
-
266
-
267
-
268
-
269
-
270
-
271
-
272
-
273
-
274
-
275
-
276
-
277
-
278
-
279
-
280
-
281
-
282
-
283
-
284
-
285
-
286
-
287
-
288
-
289
-
290
-
291
-
292
-
293
-
294
-
295
-
296
-
297
-
298
-
299
 |
 |

137
RBS Group Annual Report and Accounts 2008
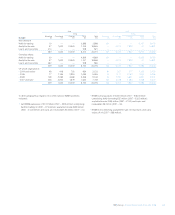
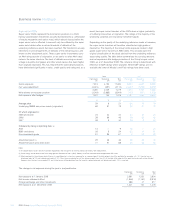
2008 2007
£m £m
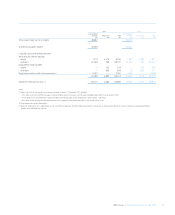
Gross exposure to CDPCs 4,776 863
Credit valuation adjustment (1,311) (44)
Net exposure to CDPCs 3,465 819
2008 2007
Notional Notional
amount Fair value Credit amount Fair value Credit
protected protected Gross valuation protected protected Gross valuation
assets assets exposure adjustment assets assets exposure adjustment
£m £m £m £m £m £m £m £m
AAA/AA rated 19,092 15,466 3,626 908 20,605 19,742 863 44
A/BBB rated 6,147 4,997 1,150 403 ————
25,239 20,463 4,776 1,311 20,605 19,742 863 44
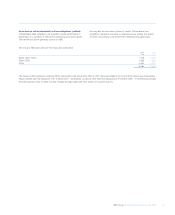
The movement in the year in CDPC CVA is analysed below:
£m
At 1 January 2008 44
Net benefit on CVA hedges 533
Net benefit on FX hedges 119
Net income statement effect 615
Balance at 31 December 2008 1,311
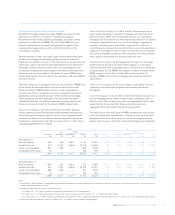
Credit derivative product companies
A credit derivative product company (CDPC) is a company that sells
protection on credit derivatives. CDPCs are similar to monoline insurers.
However, unlike monoline insurers, they are not regulated as insurers.
The Group has £4.8 billion of exposures with CDPCs which
predominatly relates to tranched credit derivatives. Tranched credit
derivatives have exposure to certain default losses that arise in
reference portfolio of assets. The Group has bought protection on
tranched credit derivatives from CDPCs. The reference portfolios of
assets are predominantly investment grade loans and bonds and on
average, the trades have exposure to total portfolio default losses that
exceed 16% of the portfolio notional up to a level of 50%. CDS spreads
have widened and credit protection has become more valuable and the
gross exposure to CDPC counterparties has increased. At the same
time, the credit quality of CDPC counterparties has declined, reflecting
the negative impact of their concentrated credit risk in a declining
market. As a result CVA adjustments taken against exposures to these
counterparties have increased significantly as described above.
The tables below present a comparison of the protected assets and the
fair value and CVA of the CDPC protection.