RBS 2008 Annual Report Download - page 67
Download and view the complete annual report
Please find page 67 of the 2008 RBS annual report below. You can navigate through the pages in the report by either clicking on the pages listed below, or by using the keyword search tool below to find specific information within the annual report.-
 1
1 -
2
-
3
-
4
-
5
-
6
-
7
-
8
-
9
-
10
-
11
-
12
-
13
-
14
-
15
-
16
-
17
-
18
-
19
-
20
-
21
-
22
-
23
-
24
-
25
-
26
-
27
-
28
-
29
-
30
-
31
-
32
-
33
-
34
-
35
-
36
-
37
-
38
-
39
-
40
-
41
-
42
-
43
-
44
-
45
-
46
-
47
-
48
-
49
-
50
-
51
-
52
-
53
-
54
-
55
-
56
-
 57
57 -
 58
58 -
 59
59 -
 60
60 -
 61
61 -
 62
62 -
 63
63 -
 64
64 -
 65
65 -
 66
66 -
 67
67 -
 68
68 -
 69
69 -
 70
70 -
 71
71 -
 72
72 -
 73
73 -
 74
74 -
 75
75 -
 76
76 -
 77
77 -
78
-
79
-
80
-
81
-
82
-
83
-
84
-
85
-
86
-
87
-
88
-
89
-
90
-
91
-
92
-
93
-
94
-
95
-
96
-
97
-
98
-
99
-
100
-
101
-
102
-
103
-
104
-
105
-
106
-
107
-
108
-
109
-
110
-
111
-
112
-
113
-
114
-
115
-
116
-
117
-
118
-
119
-
120
-
121
-
122
-
123
-
124
-
125
-
126
-
127
-
128
-
129
-
130
-
131
-
132
-
133
-
134
-
135
-
136
-
137
-
138
-
139
-
140
-
141
-
142
-
143
-
144
-
145
-
146
-
147
-
148
-
149
-
150
-
151
-
152
-
153
-
154
-
155
-
156
-
157
-
158
-
159
-
160
-
161
-
162
-
163
-
164
-
165
-
166
-
167
-
168
-
169
-
170
-
171
-
172
-
173
-
174
-
175
-
176
-
177
-
178
-
179
-
180
-
181
-
182
-
183
-
184
-
185
-
186
-
187
-
188
-
189
-
190
-
191
-
192
-
193
-
194
-
195
-
196
-
197
-
198
-
199
-
200
-
201
-
202
-
203
-
204
-
205
-
206
-
207
-
208
-
209
-
210
-
211
-
212
-
213
-
214
-
215
-
216
-
217
-
218
-
219
-
220
-
221
-
222
-
223
-
224
-
225
-
226
-
227
-
228
-
229
-
230
-
231
-
232
-
233
-
234
-
235
-
236
-
237
-
238
-
239
-
240
-
241
-
242
-
243
-
244
-
245
-
246
-
247
-
248
-
249
-
250
-
251
-
252
-
253
-
254
-
255
-
256
-
257
-
258
-
259
-
260
-
261
-
262
-
263
-
264
-
265
-
266
-
267
-
268
-
269
-
270
-
271
-
272
-
273
-
274
-
275
-
276
-
277
-
278
-
279
-
280
-
281
-
282
-
283
-
284
-
285
-
286
-
287
-
288
-
289
-
290
-
291
-
292
-
293
-
294
-
295
-
296
-
297
-
298
-
299
 |
 |

RBS Group Annual Report and Accounts 200866
Business review continued
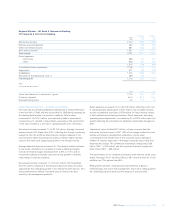
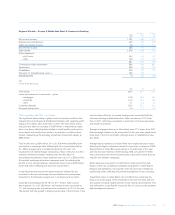
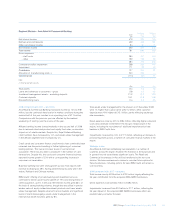
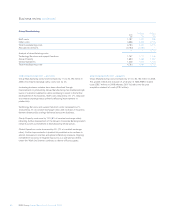
Group Manufacturing
Pro forma Statutory
2008 2007 2007
£m £m £m
Staff costs 1,197 1,221 998
Other costs 3,596 3,260 2,775
Total manufacturing costs 4,793 4,481 3,773
Allocated to divisions (4,793) (4,481) —
—— 3,773
Analysis of manufacturing costs:
Technology Services and support functions 1,757 1,717 1,336
Group Property 1,690 1,485 1,262
Global Operations 1,346 1,279 1,175
Total manufacturing costs 4,793 4,481 3,773
2008 compared with 2007 – pro forma
Group Manufacturing costs have increased by 7% to £4,793 million in
2008. At constant exchange rates, costs rose by 2%.
Increasing business volumes have been absorbed through
improvements in productivity. Group Manufacturing has maintained high
levels of customer satisfaction while continuing to invest in the further
development of the business. Staff costs reduced by 2% (7% reduction
at constant exchange rates) primarily reflecting improvements in
productivity.
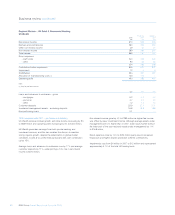
Technology Services and support functions costs increased by 2%
(reduced by 3% at constant exchange rates) with increases in business
demand balanced by savings delivered across the business.
Group Property costs rose by 14% (8% at constant exchange rates),
reflecting further development of the Group’s Corporate Banking branch
network as well as investment in Manufacturing infrastructure.
Global Operations costs increased by 5% (2% at constant exchange
rates). Further improvements in productivity enabled us to continue to
absorb increases in volumes and global inflationary pressure. Ongoing
investment in process re-engineering across our operational centres
under the ‘Work-Out’ banner continues to deliver efficiency gains.
2008 compared with 2007 – statutory
Group Manufacturing costs increased by 27% to £4,793 million in 2008.
This growth reflects the inclusion of a full year of ABN AMRO related
costs (£937 million) in 2008 whereas 2007 includes only the post
acquisition element of costs (£193 million).