RBS 2008 Annual Report Download - page 217
Download and view the complete annual report
Please find page 217 of the 2008 RBS annual report below. You can navigate through the pages in the report by either clicking on the pages listed below, or by using the keyword search tool below to find specific information within the annual report.-
 1
1 -
2
-
3
-
4
-
5
-
6
-
7
-
8
-
9
-
10
-
11
-
12
-
13
-
14
-
15
-
16
-
17
-
18
-
19
-
20
-
21
-
22
-
23
-
24
-
25
-
26
-
27
-
28
-
29
-
30
-
31
-
32
-
33
-
34
-
35
-
36
-
37
-
38
-
39
-
40
-
41
-
42
-
43
-
44
-
45
-
46
-
47
-
48
-
49
-
50
-
51
-
52
-
53
-
54
-
55
-
56
-
57
-
58
-
59
-
60
-
61
-
62
-
63
-
64
-
65
-
66
-
67
-
68
-
69
-
70
-
71
-
72
-
73
-
74
-
75
-
76
-
77
-
78
-
79
-
80
-
81
-
82
-
83
-
84
-
85
-
86
-
87
-
88
-
89
-
90
-
91
-
92
-
93
-
94
-
95
-
96
-
97
-
98
-
99
-
100
-
101
-
102
-
103
-
104
-
105
-
106
-
107
-
108
-
109
-
110
-
111
-
112
-
113
-
114
-
115
-
116
-
117
-
118
-
119
-
120
-
121
-
122
-
123
-
124
-
125
-
126
-
127
-
128
-
129
-
130
-
131
-
132
-
133
-
134
-
135
-
136
-
137
-
138
-
139
-
140
-
141
-
142
-
143
-
144
-
145
-
146
-
147
-
148
-
149
-
150
-
151
-
152
-
153
-
154
-
155
-
156
-
157
-
158
-
159
-
160
-
161
-
162
-
163
-
164
-
165
-
166
-
167
-
168
-
169
-
170
-
171
-
172
-
173
-
174
-
175
-
176
-
177
-
178
-
179
-
180
-
181
-
182
-
183
-
184
-
185
-
186
-
187
-
188
-
189
-
190
-
191
-
192
-
193
-
194
-
195
-
196
-
197
-
198
-
199
-
200
-
201
-
202
-
203
-
204
-
205
-
206
-
 207
207 -
 208
208 -
 209
209 -
 210
210 -
 211
211 -
 212
212 -
 213
213 -
 214
214 -
 215
215 -
 216
216 -
 217
217 -
 218
218 -
 219
219 -
 220
220 -
 221
221 -
 222
222 -
 223
223 -
 224
224 -
 225
225 -
 226
226 -
 227
227 -
228
-
229
-
230
-
231
-
232
-
233
-
234
-
235
-
236
-
237
-
238
-
239
-
240
-
241
-
242
-
243
-
244
-
245
-
246
-
247
-
248
-
249
-
250
-
251
-
252
-
253
-
254
-
255
-
256
-
257
-
258
-
259
-
260
-
261
-
262
-
263
-
264
-
265
-
266
-
267
-
268
-
269
-
270
-
271
-
272
-
273
-
274
-
275
-
276
-
277
-
278
-
279
-
280
-
281
-
282
-
283
-
284
-
285
-
286
-
287
-
288
-
289
-
290
-
291
-
292
-
293
-
294
-
295
-
296
-
297
-
298
-
299
 |
 |

RBS Group Annual Report and Accounts 2008216
Notes on the accounts continued
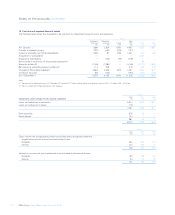
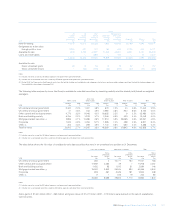
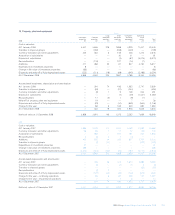
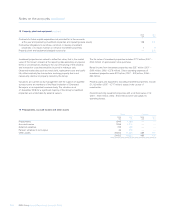
13 Derivatives (continued)
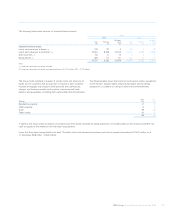
The following tables show for interest rate swaps in cash flow hedges, when the hedged cash flows are expected to occur and when they will affect
profit or loss.
2008
0-1 1-2 2-3 3-4 4-5 5-10 10-20 Over 20
Hedged forecast cash flows years years years years years years years years Total
expected to occur £m £m £m £m £m £m £m £m £m
Forecast receivable cash flows 985 779 667 554 423 1,323 407 45 5,183
Forecast payable cash flows (1,732) (1,614) (1,390) (1,059) (890) (2,880) (1,397) (257) (11,219)
2008
0-1 1-2 2-3 3-4 4-5 5-10 10-20 Over 20
Hedged forecast cash flows years years years years years years years years Total
affect profit or loss £m £m £m £m £m £m £m £m £m
Forecast receivable cash flows 871 758 659 548 421 1,284 397 40 4,978
Forecast payable cash flows (1,701) (1,576) (1,323) (1,023) (878) (2,771) (1,337) (128) (10,737)
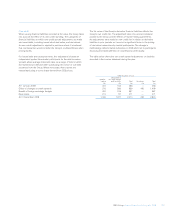
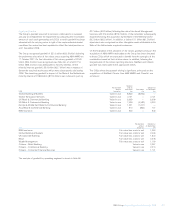
Company
2008 2007
Notional Notional
amounts Assets Liabilities amounts Assets Liabilities
£bn £m £m £bn £m £m
Exchange rate contracts 7 792 353 13 154 178
Interest rate contracts 5 376 8 1 19 1
1,168 361 173 179
Included above are derivatives held for hedging purposes as follows;
2008 2007
Assets Liabilities Assets Liabilities
Fair value hedging £m £m £m £m
Exchange rate contracts — 225 — 54
Interest rate contracts 193 — ——
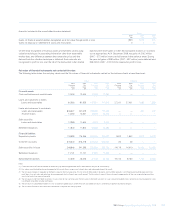
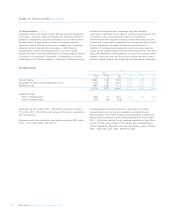
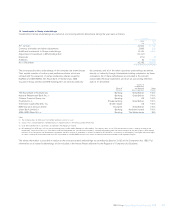
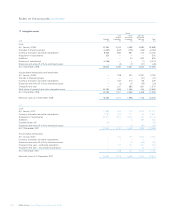
14 Debt securities
Group
UK US Other Mortgage and
central central central Bank and other asset
and local and local and local building backed
government government government society securities(1) Corporate Other(2) Total
2008 £m £m £m £m £m £m £m £m
Held-for-trading 5,372 9,859 37,519 4,407 39,879 17,671 1,573 116,280
Designated as at fair value
through profit or loss 2,085 510 472 89 236 1,580 456 5,428
Available-for-sale 11,330 6,152 32,480 12,038 62,067 6,501 2,288 132,856
Loans and receivables ———114 8,961 3,749 161 12,985
18,787 16,521 70,471 16,648 111,143 29,501 4,478 267,549
Available-for-sale
Gross unrealised gains 41 41 1,104 1,372 1,238 332 266 4,394
Gross unrealised losses — (166) (3,457) (146) (3,533) (448) (80) (7,830)