RBS 2008 Annual Report Download - page 219
Download and view the complete annual report
Please find page 219 of the 2008 RBS annual report below. You can navigate through the pages in the report by either clicking on the pages listed below, or by using the keyword search tool below to find specific information within the annual report.-
 1
1 -
2
-
3
-
4
-
5
-
6
-
7
-
8
-
9
-
10
-
11
-
12
-
13
-
14
-
15
-
16
-
17
-
18
-
19
-
20
-
21
-
22
-
23
-
24
-
25
-
26
-
27
-
28
-
29
-
30
-
31
-
32
-
33
-
34
-
35
-
36
-
37
-
38
-
39
-
40
-
41
-
42
-
43
-
44
-
45
-
46
-
47
-
48
-
49
-
50
-
51
-
52
-
53
-
54
-
55
-
56
-
57
-
58
-
59
-
60
-
61
-
62
-
63
-
64
-
65
-
66
-
67
-
68
-
69
-
70
-
71
-
72
-
73
-
74
-
75
-
76
-
77
-
78
-
79
-
80
-
81
-
82
-
83
-
84
-
85
-
86
-
87
-
88
-
89
-
90
-
91
-
92
-
93
-
94
-
95
-
96
-
97
-
98
-
99
-
100
-
101
-
102
-
103
-
104
-
105
-
106
-
107
-
108
-
109
-
110
-
111
-
112
-
113
-
114
-
115
-
116
-
117
-
118
-
119
-
120
-
121
-
122
-
123
-
124
-
125
-
126
-
127
-
128
-
129
-
130
-
131
-
132
-
133
-
134
-
135
-
136
-
137
-
138
-
139
-
140
-
141
-
142
-
143
-
144
-
145
-
146
-
147
-
148
-
149
-
150
-
151
-
152
-
153
-
154
-
155
-
156
-
157
-
158
-
159
-
160
-
161
-
162
-
163
-
164
-
165
-
166
-
167
-
168
-
169
-
170
-
171
-
172
-
173
-
174
-
175
-
176
-
177
-
178
-
179
-
180
-
181
-
182
-
183
-
184
-
185
-
186
-
187
-
188
-
189
-
190
-
191
-
192
-
193
-
194
-
195
-
196
-
197
-
198
-
199
-
200
-
201
-
202
-
203
-
204
-
205
-
206
-
207
-
208
-
 209
209 -
 210
210 -
 211
211 -
 212
212 -
 213
213 -
 214
214 -
 215
215 -
 216
216 -
 217
217 -
 218
218 -
 219
219 -
 220
220 -
 221
221 -
 222
222 -
 223
223 -
 224
224 -
 225
225 -
 226
226 -
 227
227 -
 228
228 -
 229
229 -
230
-
231
-
232
-
233
-
234
-
235
-
236
-
237
-
238
-
239
-
240
-
241
-
242
-
243
-
244
-
245
-
246
-
247
-
248
-
249
-
250
-
251
-
252
-
253
-
254
-
255
-
256
-
257
-
258
-
259
-
260
-
261
-
262
-
263
-
264
-
265
-
266
-
267
-
268
-
269
-
270
-
271
-
272
-
273
-
274
-
275
-
276
-
277
-
278
-
279
-
280
-
281
-
282
-
283
-
284
-
285
-
286
-
287
-
288
-
289
-
290
-
291
-
292
-
293
-
294
-
295
-
296
-
297
-
298
-
299
 |
 |

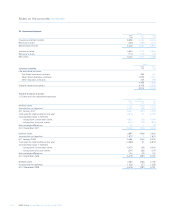
Notes on the accounts continued
RBS Group Annual Report and Accounts 2008218
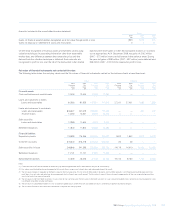
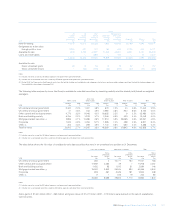
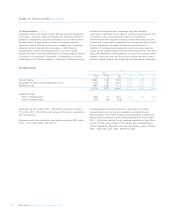
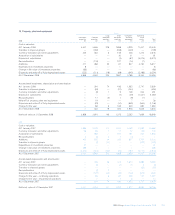
15 Equity shares
Group
2008 2007
Listed Unlisted Total Listed Unlisted Total
£m £m £m £m £m £m
Held-for-trading 15,894 1,160 17,054 33,696 3,850 37,546
Designated as at fair value through profit or loss 1,340 761 2,101 1,856 6,010 7,866
Available-for-sale 4,882 2,293 7,175 5,622 1,992 7,614
22,116 4,214 26,330 41,174 11,852 53,026
Available-for-sale
Gross unrealised gains 1,505 172 1,677 3,467 130 3,597
Gross unrealised losses (225) (103) (328) (3) (7) (10)
Gross gains of £190 million (2007 – £475 million) and gross losses of
£70 million (2007 – £9 million) were realised on the sale of available-for-
sale equity shares.
Dividend income from available-for-sale equity shares was £281 million
(2007 – £137 million; 2006 – £92 million).
Unquoted equity investments whose fair value cannot be reliably
measured are carried at cost and classified as available-for-sale
financial assets. They include capital stock (redeemable at cost) in the
Federal Home Loan Bank and the Federal Reserve Bank of £0.9 billion
(2007 – £0.5 billion) that the Group’s banking subsidiaries in the US are
required to hold; and a number of individually small shareholdings in
unlisted companies. Disposals in the year generated no gains or losses
(2007 – £0.5 million gain; 2006 – £56 million gain).
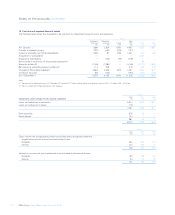
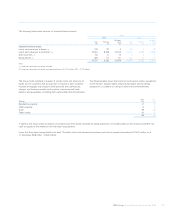
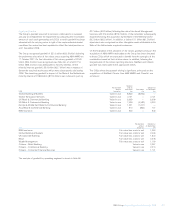
14 Debt securities (continued)
Impairment losses on available-for-sale debt securities are recognised
when there is objective evidence of impairment. The Group reviews its
portfolios of available-for-sale financial assets for such evidence which
includes: default or delinquency in interest or principal payments;
significant financial difficulty of the issuer or obligor; and it becoming
probable that the issuer will enter bankruptcy or other financial
reorganisation. However, the disappearance of an active market
because an entity’s financial instruments are no longer publicly traded is
not evidence of impairment. Furthermore, a downgrade of an entity’s
credit rating is not, of itself, evidence of impairment, although it may be
evidence of impairment when considered with other available
information. A decline in the fair value of a financial asset below its cost
or amortised cost is not necessarily evidence of impairment.
Determining whether objective evidence of impairment exists requires
the exercise of management judgment. The unrecognised losses on the
Group’s available-for-sale debt securities are concentrated in its
portfolios of mortgage-backed securities and of securities issued by
central and local governments other than the UK and the US. The losses
reflect the widening of credit spreads as a result of the reduced market
liquidity in these securities and the current uncertain macro-economic
outlook in US and Europe. The underlying securities remain unimpaired.