RBS 2008 Annual Report Download - page 135
Download and view the complete annual report
Please find page 135 of the 2008 RBS annual report below. You can navigate through the pages in the report by either clicking on the pages listed below, or by using the keyword search tool below to find specific information within the annual report.-
 1
1 -
2
-
3
-
4
-
5
-
6
-
7
-
8
-
9
-
10
-
11
-
12
-
13
-
14
-
15
-
16
-
17
-
18
-
19
-
20
-
21
-
22
-
23
-
24
-
25
-
26
-
27
-
28
-
29
-
30
-
31
-
32
-
33
-
34
-
35
-
36
-
37
-
38
-
39
-
40
-
41
-
42
-
43
-
44
-
45
-
46
-
47
-
48
-
49
-
50
-
51
-
52
-
53
-
54
-
55
-
56
-
57
-
58
-
59
-
60
-
61
-
62
-
63
-
64
-
65
-
66
-
67
-
68
-
69
-
70
-
71
-
72
-
73
-
74
-
75
-
76
-
77
-
78
-
79
-
80
-
81
-
82
-
83
-
84
-
85
-
86
-
87
-
88
-
89
-
90
-
91
-
92
-
93
-
94
-
95
-
96
-
97
-
98
-
99
-
100
-
101
-
102
-
103
-
104
-
105
-
106
-
107
-
108
-
109
-
110
-
111
-
112
-
113
-
114
-
115
-
116
-
117
-
118
-
119
-
120
-
121
-
122
-
123
-
124
-
 125
125 -
 126
126 -
 127
127 -
 128
128 -
 129
129 -
 130
130 -
 131
131 -
 132
132 -
 133
133 -
 134
134 -
 135
135 -
 136
136 -
 137
137 -
 138
138 -
 139
139 -
 140
140 -
 141
141 -
 142
142 -
 143
143 -
 144
144 -
 145
145 -
146
-
147
-
148
-
149
-
150
-
151
-
152
-
153
-
154
-
155
-
156
-
157
-
158
-
159
-
160
-
161
-
162
-
163
-
164
-
165
-
166
-
167
-
168
-
169
-
170
-
171
-
172
-
173
-
174
-
175
-
176
-
177
-
178
-
179
-
180
-
181
-
182
-
183
-
184
-
185
-
186
-
187
-
188
-
189
-
190
-
191
-
192
-
193
-
194
-
195
-
196
-
197
-
198
-
199
-
200
-
201
-
202
-
203
-
204
-
205
-
206
-
207
-
208
-
209
-
210
-
211
-
212
-
213
-
214
-
215
-
216
-
217
-
218
-
219
-
220
-
221
-
222
-
223
-
224
-
225
-
226
-
227
-
228
-
229
-
230
-
231
-
232
-
233
-
234
-
235
-
236
-
237
-
238
-
239
-
240
-
241
-
242
-
243
-
244
-
245
-
246
-
247
-
248
-
249
-
250
-
251
-
252
-
253
-
254
-
255
-
256
-
257
-
258
-
259
-
260
-
261
-
262
-
263
-
264
-
265
-
266
-
267
-
268
-
269
-
270
-
271
-
272
-
273
-
274
-
275
-
276
-
277
-
278
-
279
-
280
-
281
-
282
-
283
-
284
-
285
-
286
-
287
-
288
-
289
-
290
-
291
-
292
-
293
-
294
-
295
-
296
-
297
-
298
-
299
 |
 |

Business review continued
RBS Group Annual Report and Accounts 2008134
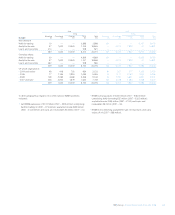
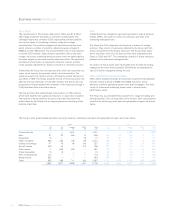
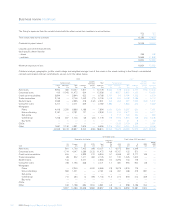
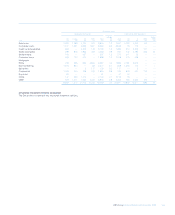
The Group’s other asset-backed securities (carrying value) by underlying asset type and geographical region are shown below.
2008 2007
US UK Europe ROW Total US UK Europe ROW Total
£m £m £m £m £m £m £m £m £m £m
Covered bonds ——3,301 — 3,301 ——2,895 — 2,895
Auto 97 29 466 13 605 156 36 108 13 313
Equipment 15 ——16 31 60 20 20 7 107
Other consumer 956 428 118 729 2,231 384 17 56 6 463
Utilities and energy 47 19 48 143 257 99 35 34 13 181
Aircraft leases 459 24 — 273 756 287 36 36 141 500
Other leases 1 525 455 — 981 378 135 133 50 696
Trade receivables 15 8——23 68 24 24 9 125
Film / entertainment 134 ———134 84 30 29 11 154
Student loans 953 ———953 629 32 32 12 705
Other 905 588 711 263 2,467 2,797 1,120 1,200 339 5,456
3,582 1,621 5,099 1,437 11,739 4,942 1,485 4,567 601 11,595
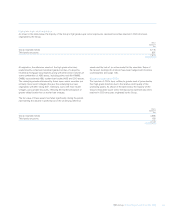
Other CDOs
The net exposure of the Group’s other senior CDOs was £1.5 billion
after hedge protection with bank or monoline counterparties. The
unhedged exposures comprise CDOs representing smaller positions
with various types of underlying collateral, rating and vintage
characteristics. The positions hedged with derivative protection from
banks include a number of positions referencing early vintages of
RMBS and other ABS assets. The Group therefore has no net exposure
to certain CDOs before credit valuation adjustment. Due to the early
vintage, the assets underlying these structures have not deteriorated to
the same degree as the more recently issued securities. The protection
purchased is from banks as opposed to monoline insurers and the
credit valuation adjustment on banks is less than on monoline insurers.
Additionally, the Group has one exposure that, while not structured as a
super senior security, incorporates similar risk characteristics. The
exposure results from options sold to a third-party conduit structure on
a portfolio of ABS. The Group assumed the risk of these securities only
after the first loss protection of had been eroded. The Group also has
protection purchased against the remainder of this exposure through a
CDS purchased from a monoline insurer.
The Group holds other subordinated note positions in CDO vehicles
which have experienced significant reductions in value since inception.
The majority of these positions are junior notes that have been fully
written down by the Group with no ongoing exposure remaining at the
balance sheet date.
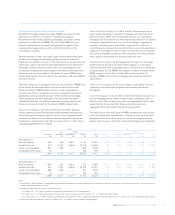
CLOs
Collateralised loan obligations represent securities in special purpose
entities (SPEs), the assets of which are primarily cash flows from
underlying leveraged loans.
The Group has CLO exposures resulting from a number of trading
activities. They consist of exposures retained by the Group and from
notes purchased from third-party structures. The Group holds super
senior securities in two CLO structures which were originated by the
Group in 2005 and 2007. The underlying collateral of these structures
predominantly references leveraged loans.
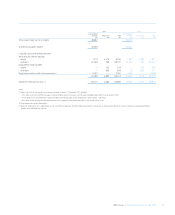
£2.3 billion of these assets were reclassified from the held-for-trading
category to the loans and receivables (£0.8 billion) and available-for-
sale (£1.5 billion) categories during the year.
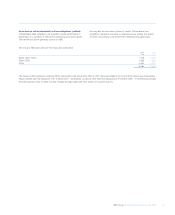
Other asset backed securities (audited)
Other assets backed securities are securities issued from securitisation
vehicles, similar to those in RMBS and CMBS structures, which
reference cashflow generating assets other than mortgages. The wide
variety of referenced underlying assets result in diverse asset
performance levels.
The Group has accumulated these assets from a range of trading and
funding activities. The carrying value of the Group’s other asset-backed
securities by underlying asset type and geographical region are shown
below.