RBS 2008 Annual Report Download - page 269
Download and view the complete annual report
Please find page 269 of the 2008 RBS annual report below. You can navigate through the pages in the report by either clicking on the pages listed below, or by using the keyword search tool below to find specific information within the annual report.-
 1
1 -
2
-
3
-
4
-
5
-
6
-
7
-
8
-
9
-
10
-
11
-
12
-
13
-
14
-
15
-
16
-
17
-
18
-
19
-
20
-
21
-
22
-
23
-
24
-
25
-
26
-
27
-
28
-
29
-
30
-
31
-
32
-
33
-
34
-
35
-
36
-
37
-
38
-
39
-
40
-
41
-
42
-
43
-
44
-
45
-
46
-
47
-
48
-
49
-
50
-
51
-
52
-
53
-
54
-
55
-
56
-
57
-
58
-
59
-
60
-
61
-
62
-
63
-
64
-
65
-
66
-
67
-
68
-
69
-
70
-
71
-
72
-
73
-
74
-
75
-
76
-
77
-
78
-
79
-
80
-
81
-
82
-
83
-
84
-
85
-
86
-
87
-
88
-
89
-
90
-
91
-
92
-
93
-
94
-
95
-
96
-
97
-
98
-
99
-
100
-
101
-
102
-
103
-
104
-
105
-
106
-
107
-
108
-
109
-
110
-
111
-
112
-
113
-
114
-
115
-
116
-
117
-
118
-
119
-
120
-
121
-
122
-
123
-
124
-
125
-
126
-
127
-
128
-
129
-
130
-
131
-
132
-
133
-
134
-
135
-
136
-
137
-
138
-
139
-
140
-
141
-
142
-
143
-
144
-
145
-
146
-
147
-
148
-
149
-
150
-
151
-
152
-
153
-
154
-
155
-
156
-
157
-
158
-
159
-
160
-
161
-
162
-
163
-
164
-
165
-
166
-
167
-
168
-
169
-
170
-
171
-
172
-
173
-
174
-
175
-
176
-
177
-
178
-
179
-
180
-
181
-
182
-
183
-
184
-
185
-
186
-
187
-
188
-
189
-
190
-
191
-
192
-
193
-
194
-
195
-
196
-
197
-
198
-
199
-
200
-
201
-
202
-
203
-
204
-
205
-
206
-
207
-
208
-
209
-
210
-
211
-
212
-
213
-
214
-
215
-
216
-
217
-
218
-
219
-
220
-
221
-
222
-
223
-
224
-
225
-
226
-
227
-
228
-
229
-
230
-
231
-
232
-
233
-
234
-
235
-
236
-
237
-
238
-
239
-
240
-
241
-
242
-
243
-
244
-
245
-
246
-
247
-
248
-
249
-
250
-
251
-
252
-
253
-
254
-
255
-
256
-
257
-
258
-
 259
259 -
 260
260 -
 261
261 -
 262
262 -
 263
263 -
 264
264 -
 265
265 -
 266
266 -
 267
267 -
 268
268 -
 269
269 -
 270
270 -
 271
271 -
 272
272 -
 273
273 -
 274
274 -
 275
275 -
 276
276 -
 277
277 -
 278
278 -
 279
279 -
280
-
281
-
282
-
283
-
284
-
285
-
286
-
287
-
288
-
289
-
290
-
291
-
292
-
293
-
294
-
295
-
296
-
297
-
298
-
299
 |
 |

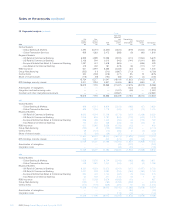
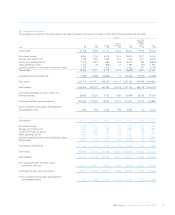
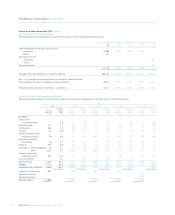
RBS Group Annual Report and Accounts 2008268
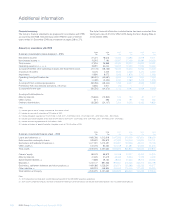
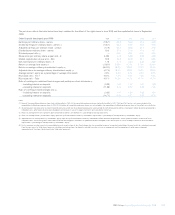
Additional information
Amounts in accordance with IFRS
2008 2008 2007 2006 2005 2004
Summary consolidated income statement – IFRS $m £m £m £m £m £m
Net interest income 27,301 18,675 12,069 10,596 9,918 9,071
Non-interest income (1) 10,515 7,193 18,297 17,406 15,984 14,320
Total income 37,816 25,868 30,366 28,002 25,902 23,391
Operating expenses (2, 3, 4, 5, 6) 78,991 54,033 13,942 12,480 11,946 10,362
(Loss)/profit before other operating charges and impairment losses (41,175) (28,165) 16,424 15,522 13,956 13,029
Insurance net claims 6,476 4,430 4,624 4,458 4,313 4,260
Impairment 11,800 8,072 1,968 1,878 1,707 1,485
Operating (loss)/profit before tax (59,451) (40,667) 9,832 9,186 7,936 7,284
Tax (3,396) (2,323) 2,044 2,689 2,378 1,995
(Loss)/profit from continuing operations (56,055) (38,344) 7,788 6,497 5,558 5,289
Profit/(loss) from discontinued operations, net of tax 5,805 3,971 (76) ———
(Loss)/profit for the year (50,250) (34,373) 7,712 6,497 5,558 5,289
(Loss)/profit attributable to:
Minority interests (15,835) (10,832) 163 104 57 177
Other owners 871 596 246 191 109 256
Ordinary shareholders (35,286) (24,137) 7,303 6,202 5,392 4,856
Notes:
(1) Includes gain on sale of strategic investment of £333 million in 2005.
(2) Includes loss on sale of subsidiaries of £93 million in 2005.
(3) Includes integration expenditure of £1,050 million in 2008 (2007 – £108 million; 2006 – £134 million; 2005 – £458 million; 2004 – £520 million).
(4) Includes purchased intangibles amortisation of £919 million in 2008 (2007 – £234 million; 2006 – £94 million; 2005 – £97 million; 2004 – £45 million).
(5) Includes restructuring expenditure of £307 million in 2008.
(6) Includes write-down of goodwill and other intangibles assets of £32,581 million in 2008.
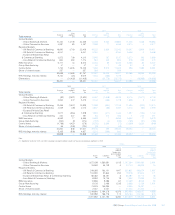
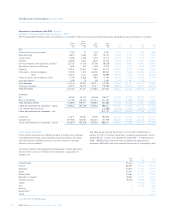
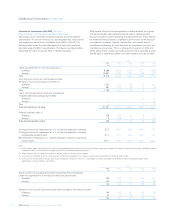
2008 2008 2007 2006 2005 2004
Summary consolidated balance sheet – IFRS $m £m £m £m £m £m
Loans and advances (1) 1,480,786 1,012,919 1,047,998 549,499 487,813 408,324
Debt securities and equity shares 429,622 293,879 347,682 146,246 135,804 104,741
Derivatives and settlement balances (2) 1,477,091 1,010,391 293,991 109,506 89,470 15,193
Other assets (1) 123,476 84,463 151,158 51,581 51,542 51,575
Total assets 3,510,975 2,401,652 1,840,829 856,832 764,629 579,833
Owners’ equity 86,075 58,879 53,038 40,227 35,435 33,905
Minority interests 31,605 21,619 38,388 5,263 2,109 3,492
Subordinated liabilities (1) 71,858 49,154 38,043 27,654 28,274 20,366
Deposits (1) 1,312,137 897,556 994,657 516,365 453,274 383,198
Derivatives, settlement balances and short positions (2) 1,499,385 1,025,641 363,073 152,988 128,228 43,577
Other liabilities (1) 509,915 348,803 353,630 114,335 117,309 95,295
Total liabilities and equity 3,510,975 2,401,652 1,840,829 856,832 764,629 579,833
Notes:
(1) 2007 comparative data have been restated following finalisation of the ABN AMRO acquisition accounting.
(2) 2007 to 2004 comparative amounts have been restated for the netting of certain derivative asset and derivative liability balances with the London Clearing House.
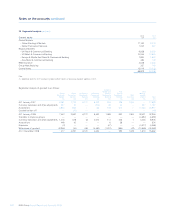
Financial summary
The Group’s financial statements are prepared in accordance with IFRS
as issued by the IASB. Selected data under IFRS for each of the five
years ended 31 December 2008 are presented on pages 268 to 276.
The dollar financial information included below has been converted from
sterling at a rate of £1.00 to US$1.4619, being the Noon Buying Rate on
31 December 2008.