RBS 2008 Annual Report Download - page 272
Download and view the complete annual report
Please find page 272 of the 2008 RBS annual report below. You can navigate through the pages in the report by either clicking on the pages listed below, or by using the keyword search tool below to find specific information within the annual report.-
 1
1 -
2
-
3
-
4
-
5
-
6
-
7
-
8
-
9
-
10
-
11
-
12
-
13
-
14
-
15
-
16
-
17
-
18
-
19
-
20
-
21
-
22
-
23
-
24
-
25
-
26
-
27
-
28
-
29
-
30
-
31
-
32
-
33
-
34
-
35
-
36
-
37
-
38
-
39
-
40
-
41
-
42
-
43
-
44
-
45
-
46
-
47
-
48
-
49
-
50
-
51
-
52
-
53
-
54
-
55
-
56
-
57
-
58
-
59
-
60
-
61
-
62
-
63
-
64
-
65
-
66
-
67
-
68
-
69
-
70
-
71
-
72
-
73
-
74
-
75
-
76
-
77
-
78
-
79
-
80
-
81
-
82
-
83
-
84
-
85
-
86
-
87
-
88
-
89
-
90
-
91
-
92
-
93
-
94
-
95
-
96
-
97
-
98
-
99
-
100
-
101
-
102
-
103
-
104
-
105
-
106
-
107
-
108
-
109
-
110
-
111
-
112
-
113
-
114
-
115
-
116
-
117
-
118
-
119
-
120
-
121
-
122
-
123
-
124
-
125
-
126
-
127
-
128
-
129
-
130
-
131
-
132
-
133
-
134
-
135
-
136
-
137
-
138
-
139
-
140
-
141
-
142
-
143
-
144
-
145
-
146
-
147
-
148
-
149
-
150
-
151
-
152
-
153
-
154
-
155
-
156
-
157
-
158
-
159
-
160
-
161
-
162
-
163
-
164
-
165
-
166
-
167
-
168
-
169
-
170
-
171
-
172
-
173
-
174
-
175
-
176
-
177
-
178
-
179
-
180
-
181
-
182
-
183
-
184
-
185
-
186
-
187
-
188
-
189
-
190
-
191
-
192
-
193
-
194
-
195
-
196
-
197
-
198
-
199
-
200
-
201
-
202
-
203
-
204
-
205
-
206
-
207
-
208
-
209
-
210
-
211
-
212
-
213
-
214
-
215
-
216
-
217
-
218
-
219
-
220
-
221
-
222
-
223
-
224
-
225
-
226
-
227
-
228
-
229
-
230
-
231
-
232
-
233
-
234
-
235
-
236
-
237
-
238
-
239
-
240
-
241
-
242
-
243
-
244
-
245
-
246
-
247
-
248
-
249
-
250
-
251
-
252
-
253
-
254
-
255
-
256
-
257
-
258
-
259
-
260
-
261
-
 262
262 -
 263
263 -
 264
264 -
 265
265 -
 266
266 -
 267
267 -
 268
268 -
 269
269 -
 270
270 -
 271
271 -
 272
272 -
 273
273 -
 274
274 -
 275
275 -
 276
276 -
 277
277 -
 278
278 -
 279
279 -
 280
280 -
 281
281 -
 282
282 -
283
-
284
-
285
-
286
-
287
-
288
-
289
-
290
-
291
-
292
-
293
-
294
-
295
-
296
-
297
-
298
-
299
 |
 |

271RBS Group Annual Report and Accounts 2008
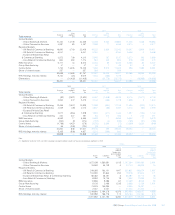
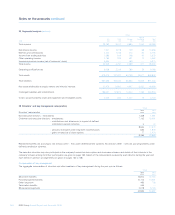
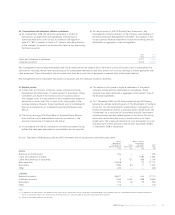
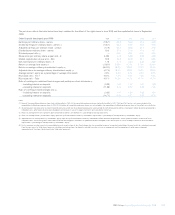
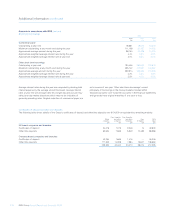
Loan impairment provisions
For a discussion of the factors considered in determining the amount of the provisions, see ‘Impairment’ on page 99 and ‘Critical accounting policies
– Loan impairment provisions’ on pages 185 and 186.
The following table shows the elements of loan impairment provisions.
IFRS
2008 2007 2006 2005 2004
£m £m £m £m £m
Provisions at the beginning of the year
Domestic 3,258 3,037 2,759 2,675 2,408
Foreign 3,194 898 1,128 1,470 1,477
6,452 3,935 3,887 4,145 3,885
Transfer to disposal groups
Domestic — ————
Foreign (767) ————
(767) ————
Currency translation and other adjustments
Domestic 107 5 (17) (7) (8)
Foreign 1,334 178 (44) 58 (90)
1,441 183 (61) 51 (98)
(Disposals)/acquisitions of businesses
Domestic (108) 10 —— 2
Foreign (70) 2,211 ——288
(178) 2,221 ——290
Amounts written-off
Domestic (1,446) (1,222) (1,360) (1,252) (901)
Foreign (1,702) (789) (481) (788) (548)
(3,148) (2,011) (1,841) (2,040) (1,449)
Recoveries of amounts written-off in previous years
Domestic 116 158 119 97 85
Foreign 203 184 96 75 59
319 342 215 172 144
Charged to income statement
Domestic 2,698 1,420 1,663 1,376 960
Foreign 4,393 526 214 327 442
7,091 1,946 1,877 1,703 1,402
Unwind of discount
Domestic (151) (150) (127) (130) —
Foreign (43) (14) (15) (14) —
(194) (164) (142) (144) —
Provisions at the end of the year (1)
Domestic 4,474 3,258 3,037 2,759 2,546
Foreign 6,542 3,194 898 1,128 1,628
11,016 6,452 3,935 3,887 4,174
Gross loans and advances to customers
Domestic 312,287 323,362 251,522 232,319 194,654
Foreign 573,324 511,625 219,304 188,791 156,765
885,611 834,987 470,826 421,110 351,419
Closing customer provisions as a % of gross loans
and advances to customers (2)
Domestic 1.43% 1.01% 1.21% 1.19% 1.31%
Foreign 1.12% 0.62% 0.41% 0.60% 1.04%
Total 1.23% 0.77% 0.84% 0.92% 1.19%
Customer charge to income statement as a % of gross loans
and advances to customers
Domestic 0.86% 0.44% 0.66% 0.59% 0.49%
Foreign 0.75% 0.10% 0.10% 0.17% 0.28%
Total 0.79% 0.23% 0.40% 0.40% 0.40%
Notes:
(1) Includes closing provisions against loans and advances to banks of £127 million (2007 – £3 million; 2006 – £2 million; 2005 – £3 million; 2004 – £6 million).
(2) Closing customer provisions exclude closing provisions against loans and advances to banks.