RBS 2008 Annual Report Download - page 270
Download and view the complete annual report
Please find page 270 of the 2008 RBS annual report below. You can navigate through the pages in the report by either clicking on the pages listed below, or by using the keyword search tool below to find specific information within the annual report.-
 1
1 -
2
-
3
-
4
-
5
-
6
-
7
-
8
-
9
-
10
-
11
-
12
-
13
-
14
-
15
-
16
-
17
-
18
-
19
-
20
-
21
-
22
-
23
-
24
-
25
-
26
-
27
-
28
-
29
-
30
-
31
-
32
-
33
-
34
-
35
-
36
-
37
-
38
-
39
-
40
-
41
-
42
-
43
-
44
-
45
-
46
-
47
-
48
-
49
-
50
-
51
-
52
-
53
-
54
-
55
-
56
-
57
-
58
-
59
-
60
-
61
-
62
-
63
-
64
-
65
-
66
-
67
-
68
-
69
-
70
-
71
-
72
-
73
-
74
-
75
-
76
-
77
-
78
-
79
-
80
-
81
-
82
-
83
-
84
-
85
-
86
-
87
-
88
-
89
-
90
-
91
-
92
-
93
-
94
-
95
-
96
-
97
-
98
-
99
-
100
-
101
-
102
-
103
-
104
-
105
-
106
-
107
-
108
-
109
-
110
-
111
-
112
-
113
-
114
-
115
-
116
-
117
-
118
-
119
-
120
-
121
-
122
-
123
-
124
-
125
-
126
-
127
-
128
-
129
-
130
-
131
-
132
-
133
-
134
-
135
-
136
-
137
-
138
-
139
-
140
-
141
-
142
-
143
-
144
-
145
-
146
-
147
-
148
-
149
-
150
-
151
-
152
-
153
-
154
-
155
-
156
-
157
-
158
-
159
-
160
-
161
-
162
-
163
-
164
-
165
-
166
-
167
-
168
-
169
-
170
-
171
-
172
-
173
-
174
-
175
-
176
-
177
-
178
-
179
-
180
-
181
-
182
-
183
-
184
-
185
-
186
-
187
-
188
-
189
-
190
-
191
-
192
-
193
-
194
-
195
-
196
-
197
-
198
-
199
-
200
-
201
-
202
-
203
-
204
-
205
-
206
-
207
-
208
-
209
-
210
-
211
-
212
-
213
-
214
-
215
-
216
-
217
-
218
-
219
-
220
-
221
-
222
-
223
-
224
-
225
-
226
-
227
-
228
-
229
-
230
-
231
-
232
-
233
-
234
-
235
-
236
-
237
-
238
-
239
-
240
-
241
-
242
-
243
-
244
-
245
-
246
-
247
-
248
-
249
-
250
-
251
-
252
-
253
-
254
-
255
-
256
-
257
-
258
-
259
-
 260
260 -
 261
261 -
 262
262 -
 263
263 -
 264
264 -
 265
265 -
 266
266 -
 267
267 -
 268
268 -
 269
269 -
 270
270 -
 271
271 -
 272
272 -
 273
273 -
 274
274 -
 275
275 -
 276
276 -
 277
277 -
 278
278 -
 279
279 -
 280
280 -
281
-
282
-
283
-
284
-
285
-
286
-
287
-
288
-
289
-
290
-
291
-
292
-
293
-
294
-
295
-
296
-
297
-
298
-
299
 |
 |

269RBS Group Annual Report and Accounts 2008
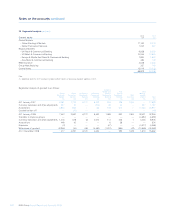
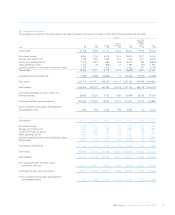
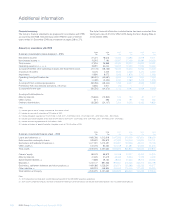
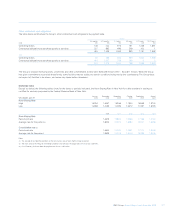
The per share data in the table below have been restated for the effect of the rights issue in June 2008 and the capitalisation issue in September
2008.
Other financial data based upon IFRS 2008 2007 2006 2005 2004
Earnings per ordinary share – pence (145.7) 64.0 54.4 47.3 43.9
Diluted earnings per ordinary share – pence (1) (145.7) 63.4 53.9 47.0 43.5
Adjusted earnings per ordinary share – pence (12.9) 63.3 55.8 49.1 47.5
Dividends per ordinary share – pence 19.3 27.0 21.6 17.0 14.7
Dividend payout ratio (2) —43% 45% 41% 35%
Share price per ordinary share at year end – £ 0.494 3.72 5.56 4.90 4.89
Market capitalisation at year end – £bn 19.5 44.4 62.8 56.1 55.6
Net asset value per ordinary share – £ 1.15 3.74 3.24 2.83 2.59
Return on average total assets (3) (1.18%) 0.65% 0.74% 0.73% 0.94%
Return on average ordinary shareholders’ equity (4) (50.0%) 18.8% 18.5% 17.5% 18.3%
Adjusted return on average ordinary shareholders’ equity (5) (4.7%) 18.6% 19.0% 18.2% 18.9%
Average owners’ equity as a percentage of average total assets 2.9% 3.9% 4.4% 4.5% 5.9%
Risk asset ratio – Tier 1 10.0% 7.3% 7.5% 7.6% 7.0%
Risk asset ratio – Total 14.1% 11.2% 11.7% 11.7% 11.7%
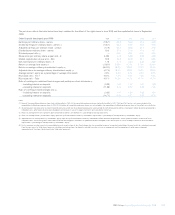
Ratio of earnings to combined fixed charges and preference share dividends (6)
– including interest on deposits (0.29) 1.45 1.62 1.67 1.88
– excluding interest on deposits (11.96) 5.73 6.12 6.05 7.43
Ratio of earnings to fixed charges only (6)
– including interest on deposits (0.30) 1.47 1.64 1.69 1.94
– excluding interest on deposits (14.71) 6.53 6.87 6.50 9.70
Notes:
(1) None of the convertible preference shares had a dilutive effect in 2008. All the convertible preference shares had a dilutive effect in 2007, 2006 and 2005 and as such were included in the
computation of diluted earnings per share. In 2004, $1,500 million of convertible preference shares was not included in the computation of diluted earnings per share as their effect was anti-dilutive.
(2) Dividend payout ratio represents the interim dividend paid and current year final dividend proposed as a percentage of profit attributable to ordinary shareholders before discontinued operations,
integration costs, amortisation of purchased intangibles and net gain on sale of strategic investments and subsidiaries (net of tax).
(3) Return on average total assets represents profit attributable to ordinary shareholders as a percentage of average total assets.
(4) Return on average ordinary shareholders’ equity represents profit attributable to ordinary shareholders expressed as a percentage of average ordinary shareholders’ equity.
(5) Adjusted return on average ordinary shareholders’ equity represents profit attributable to ordinary shareholders before discontinued operations, credit market write-downs and one-off items,
integration costs, restructuring costs, amortisation of purchased intangibles, write-downs of goodwill and other intangible assets and net gain on sale of strategic investments and subsidiaries
expressed as a percentage of average ordinary shareholders’ equity.
(6) For this purpose, earnings consist of income before tax and minority interests, plus fixed charges less the unremitted income of associated undertakings (share of profits less dividends received).
Fixed charges consist of total interest expense, including or excluding interest on deposits and debt securities in issue, as appropriate, and the proportion of rental expense deemed
representative of the interest factor (one third of total rental expenses).